
This article looks at the real estate investment trusts or REITs on Bursa Malaysia. We derive the base rates for the REITs sector, which are then used to identify three potential REITs – ALAQR, ATRIUM, and KIPREIT for further investigation. Find out if investors should consider these REITs in Malaysia.

In my previous article In Malaysia, which has better returns: the stock market or property? I proposed that if you had a 30-year investment horizon, you are better off investing in properties. But we all know the challenges of investing directly in property.
Property requires a significant amount of time and energy. You have to deal with tenant issues, maintenance emergencies, and liabilities if an accident happens on your property. Property also requires financing and more often than not, you would have to take on a mortgage or some other type of financing to finance your investment. And finally, property is an illiquid asset.
As such, many see Real Estate Investment Trusts or REITs as an alternative. REITs allow individual investors to make real estate money without owning or managing physical properties.
I wanted to see if there were REITs on Bursa Malaysia that could be considered for investment. I had two goals in mind: to derive the base rates for the sector and to identify a few potential REITs for further analysis. Eventually, I identified three REITs for further investigation: ALAQR, ATRIUM, and KIPREIT. Should you invest in them? Well, read on.
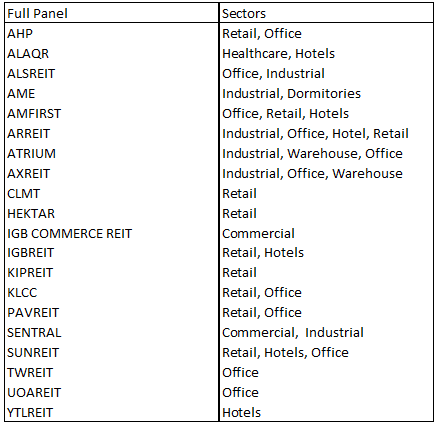
As of mid-Sep 2022, there were 19 REITs on Bursa Malaysia. Two were listed only recently – AME in 2022 and IGB Commerce in 2021. As I was interested in REIT performances over several years, I had to exclude these two from my analysis. Another REIT, AHP, was taken private by mid-Sep 2022. But its information was available till 2021. As such, I have included AHP in my compilation of base rates.
In the case of another REIT – KIPREIT, its earliest data was from 2014. As such, I left it out in the base rate analysis but included it when screening REITs for investment. All in all, I covered 17 REITS in my base rates. Not all of them had 15 years of historical data. Therefore, I split them into two categories:
- Those with financials from 2007 (12 REITs in this category)
- Those with financials from 2012 (17 REITs in this category)
Refer to Appendix 1 for the list of REITs in each category here.
What is a REIT?
A REIT is an investment vehicle that pools monies from many investors for investment in properties. A REIT company owns, operates, or finances income-producing properties such as apartments, data centres, offices, and shopping malls. REITs generate a steady income stream for investors but offer little in the way of capital appreciation. Most REITs are publicly traded like stocks, which makes them highly liquid, unlike physical real estate investments.
According to the US National Association of Real Estate Investment Trusts, REITs offer the benefits of commercial real estate investment coupled with the advantages of investing in a publicly traded stock. The investment characteristics of income-producing real estate have provided REIT investors with historically competitive long-term rates of return that complement the returns from other stocks and bonds.
REITs have been in Malaysia for two decades. They started out as so-called property trusts. The first listing was in 1989 by Amanah Harta Tanah PNB 2. This was followed soon after by the Arab Malaysian First Property Trust. Property trusts never really took off in Malaysia until 2005, when it was rebranded as REITs following the Securities Commission Malaysia’s introduction of Guidelines on Real Estate Investment Trusts under section 377 of the Capital Markets and Services Act 2007.
As of mid-Sep 2022, 19 REITs were operating in Malaysia (Table 1) in multiple sectors. I have included AHP in the panel, so the total came to 20 REITs.
Notes
a) Retail generally covers shopping centres.
b) Commercial generally covers buildings used for offices with some retail components
c) Most of the commercial, office, retail, and hotels include car parks serving the buildings
➡️Click here for the respective REITs company profile on Bursa Malaysia.
Performance of REITs in Malaysia
To collect the base rates data, I tracked the performances of these REITs over the past 15 years (2007 to 2021).
Only 12 REITs had data from 2007. To get a more comprehensive representation, I factored in the 17 REITs with data from 2012 (10 years of data). Refer to the Appendix for the list of these companies. Refer to the Method section for details on how I computed the various metrics.
My focus was on the trends of the Selected 12 over the years, but for further information on the past few years, I referred to the Selected 17. The profiles of these companies are shown in the following table.
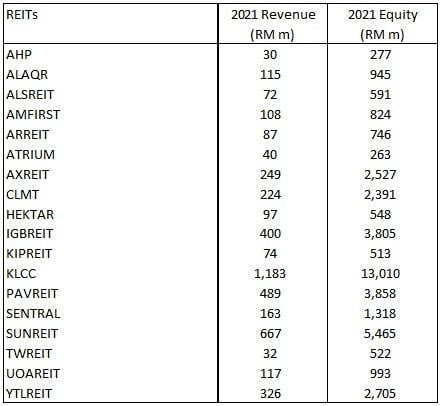
Note: Except for the profile info, KIPREIT data was not included in the base rates analyses.
You can see that the REITs ranged in size:
- The 2021 equity of the panel ranged from RM263 million to RM13.1 billion, with an average of RM2.3 billion. For scale, the average equity for the KLCI component companies was about RM22 billion.
- The 2021 revenue of the panel ranged from RM30 million to RM1.2 billion, with an average of RM248 million. By contrast, the average revenue of the KLCI component companies was about RM13 billion.
You will notice that the equity and revenue for the majority of the panel companies were smaller than the industry average. In other words, this is a sector where a few large REITs skewed the average results.
As represented by the Selected 12, the sector had a very challenging past 15 years.
- The mean revenue only grew at a compound annual growth rate (CAGR) of 5.3%, while the mean profit after tax (PAT) declined at a compounded 12.7% per annum.
- While rentals grew from 2007 to peak in 2019, rental yield did not show a similar growth pattern. The mean gross rental yield ranged from 6.8% to 9.0% from 2007 to 2021.
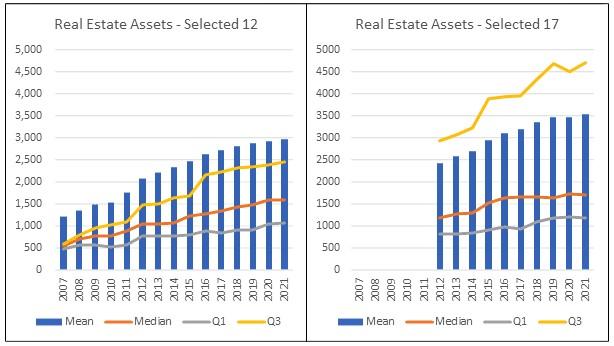
- Real estate assets grew at a 6.6% CAGR from 2007 to 2021. This growth was funded by an increase in equity and debt, with debt growing at a higher rate. This resulted in an average debt-equity ratio for 2019 to 2021 of 0.64 compared to the 2007 to 2009 average of 0.42.
- Funds from operations (FFO) per share declined at a compounded annual rate of 8.4% from 2007 to 2021 due to a declining FFO and an increased number of shares from increased equity.
I discuss the sector’s performance in detail in the following sections.
1. Revenue
From 2007 to 2021, the mean revenue of the Selected 12 grew at a CAGR of 5.3%. But as seen from Chart 1, the revenue peaked in 2019 as performances in 2020 and 2021 were affected by the Covid-19 pandemic.
Note that there was a decline in revenue in 2011. This was mainly due to the rationalisation of the YTLREIT (then known as Starhill REIT). Two of its properties were sold to the Starhill Global Real Estate Investment Trust in Singapore in 2010.
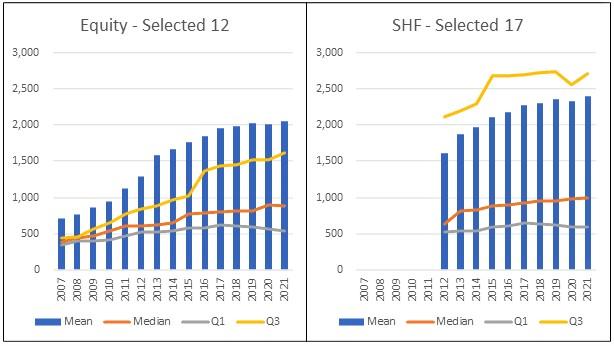
Another salient feature of the Selected 12 was that the means were higher than the upper quartile values (denoted by Q3 in the chart). This was because a few relatively large companies (Table 2) skewed the mean values.
However, when you look at a larger group, the mean values fell below the upper quartiles, as seen in the Selected 17 part of Chart 1.
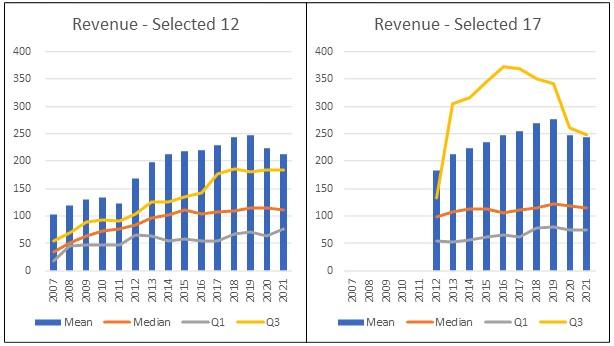
Note: In these charts, the sector mean is represented in columns. The other metrics – median, lower quartile (Q1), and upper quartile (Q3) are shown as lines.
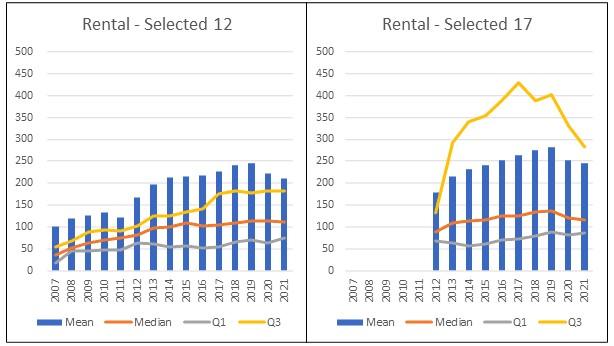
2. Rental
The most significant contributor to the revenue of a REIT is rental. You should not be surprised that the rental trends (Chart 2) show the same pattern as those for the revenue.
The mean rental for the Selected 12 grew at a CAGR of 5.4% from 2007 to 2021. The impact of Covid-19 on the sector can be seen from the Selected 17 part of Chart 2, where:
- The mean rental declined by 10% from 2019 to 2021, with a further 3% decline from 2020 to 2021.
- The larger companies suffered the worst, as seen from the upper quartile line.
Despite having long-term tenancy agreements, the sector experienced a decline during the Covid-19 years. The takeaway is that REITs do not offer rental protection during extraordinary periods.
SEE WHAT OTHERS ARE READING:
➡️ How to invest in REITs in Malaysia and why it is an alternative to property investment.
➡️ Best properties in Klang Valley with the highest rental price growth in H1 2022
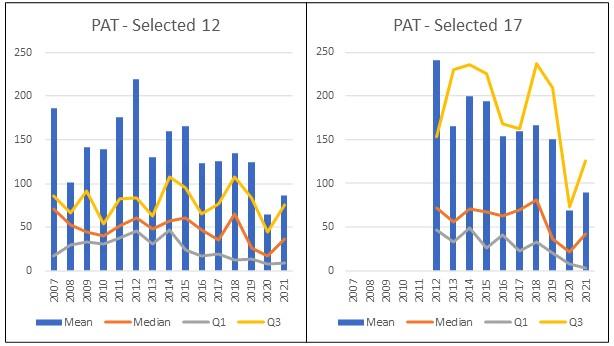
3. Profit After Tax (PAT)

The net income for the sector was very volatile, as illustrated in Chart 3. I mentioned earlier the unusual characteristic of the mean being above the upper quartile for the revenue for the Selected 12. We see a similar picture for the profit after tax (PAT) for the Selected 12.
The sector PAT peaked in 2012 and has been on a downward trend ever since. From 2007 to 2021, the PAT declined at an annual compounded rate of 12.7%,
The only positive was that the 2021 PAT was higher than 2020 despite lower revenues in 2021.
Interestingly, the PAT profile did not match that of the rental. Rental grew from 2007 to peak in 2019. However, PAT did not have this growth pattern. Rather PAT had an up-and-down pattern from 2007 to 2019.
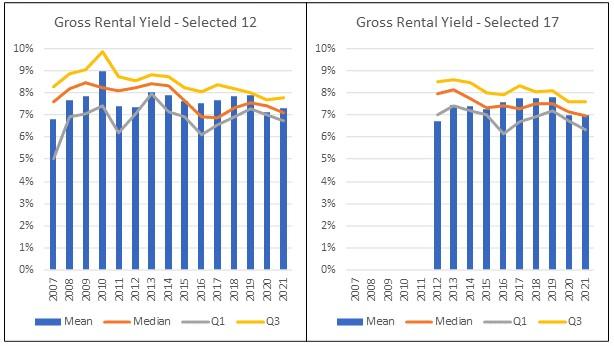
4. Gross Rental Yield
Gross rental yield is a crucial metric in property investment. Rental yield essentially compares the amount of money a property generates as a percentage of the property value. It provides a better idea of the ongoing return one will earn on an investment.
Chart 4 shows that while rentals grew from 2007 to peak in 2019, rental yield did not show a similar growth pattern.
- The mean gross rental yield for the Selected 12 ranged from 6.8% to 9.0% from 2007 to 2021.
- The mean gross rental yield for the Selected 17 had a smaller range of 6.7% to 7.8% over the past ten years.
The only explanation for this was that property values increased at the same time rentals went up, as suggested by Chart 5, which shows the trends in the value of the real estate assets of the REITs.
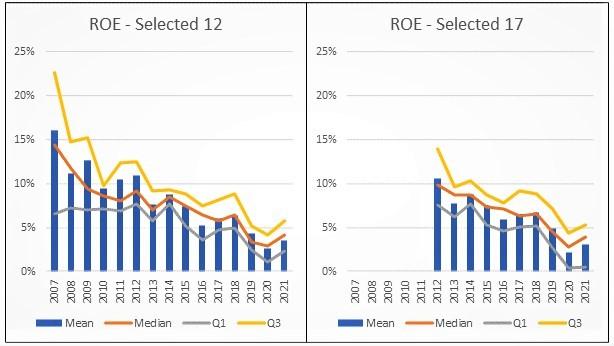
5. Return on Equity
As can be seen from Chart 6, the return on equity (ROE) has been on a downward trend since 2007. It did not matter whether you looked at the mean, median, or quartiles.
- In the Selected 12, the values in 2021 were lower than in 2007. From 2007 to 2021, the mean ROE declined at a compounded annual rate of 10.4%.
- Over the past ten years, we have seen a similar decline in ROE. From 2012 to 2021, the mean ROE declined at a compounded annual rate of 12.7%.
6. Capital Structure
Unlike regular stocks, REITs are unique because they pay out their dividends from their free cash flow. As REITs pay out almost all their cash flow as dividends, they retain very little cash flow to carry out growth initiatives such as purchasing new properties. REITs grow by tapping the capital markets. You can see this by looking at the balance sheet of a typical REIT.
Assets = Equity + Liabilities
In other words, REIT managers can fund new purchases or other capital requirements by adding to the equity or liabilities. As can be seen in Chart 5, the real estate assets of the REITs have grown yearly. In the Selected 12, real estate assets grew at a 6.6% CAGR from 2007 to 2021. How did they fund this growth? You can see from Charts 7 and 8 that both equity and debt have been growing.
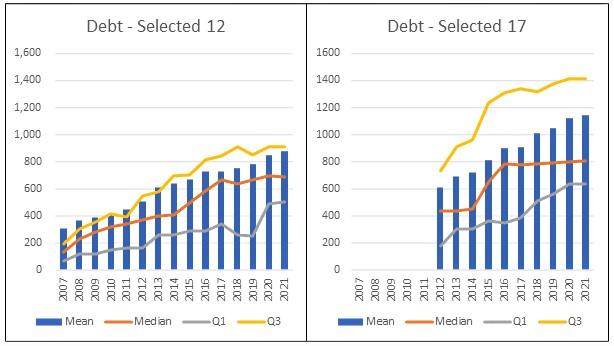
However, debt has been growing at a higher rate than equity, so the debt-equity ratio has risen. In the Selected 12, the three years mean debt-equity ratio for 2007 to 2009 was 0.42. This increased to 0.64 from 2019 to 2021.
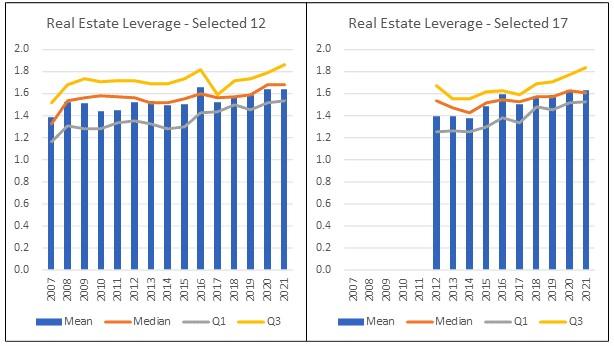
Another perspective of the debt position is to look at the leverage. This was derived as real estate assets divided by equity. As can be seen from Chart 8, the leverage for the sector has increased over the past 15 years. In the Selected 12, the mean leverage was 1.4 in 2007. This increased to 1.6 in 2021.
7. Fund Flow from Operations (FFO)
FFO refers to the figure used by REITs to define the cash flow from their operations. Real estate companies use FFO as a measurement of operating performance. I computed the FFO by adding depreciation, amortisation, and losses on sales of assets to earnings and then subtracting any gains on sales of assets.
You can see from Chart 10 that the FFO for Selected 12 has been volatile. It had a coefficient of variation (ratio of standard deviation to the mean) of 0.23. Given how FFO was computed, you should not be surprised that the FFO profile is very similar to the PAT’s.
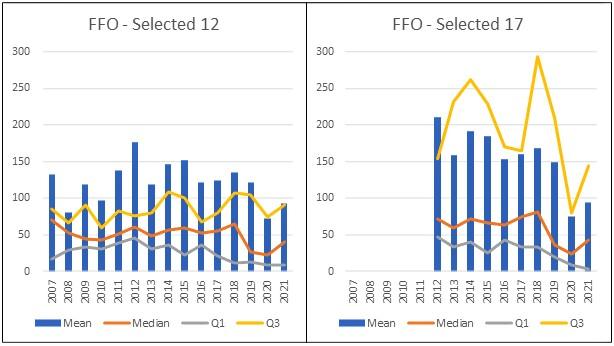
However, the FFO per share in Chart 11 reveals a declining trend. This results from a declining FFO and increased shares resulting from increased equity. Based on the Selected 12, FFO per share declined at an annual compounded rate of 8.4% from 2007 to 2021.
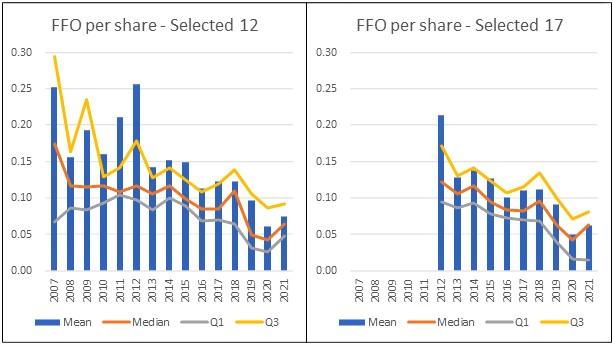
Many would consider FFO per share as a reasonable valuation metric for REITs. If so, REITs have not been very profitable over the past 15 years.
FIND OUT: Malaysia property buying guide for foreigners in 2022
Screening for investment opportunities

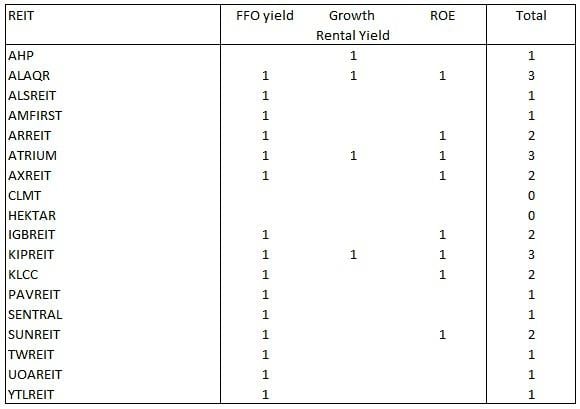
I used three metrics to screen for investment opportunities. One relates to valuation, while the other two relate to the fundamentals.
- FFO Yield > 5%. This was derived by taking the average FFO per share divided by the market price as of 15 Sep 2022.
- ROE > 5%. My target is a return more significant than the average ROE of the 18 REITs.
- Growth in rental yield > 0%.
For consistency, I looked at the average performance of REITs from 2017 to 2021, a period where I had data from all 18 REITs, including KIPREIT. Table 3 summarises the performances of the 18 REITs. Note that I have included AHP in the screen even though it is no longer listed. This is to provide a comparison of the fundamental metrics.
Notes
(a) As of 15 Sep 2022.
(b) Based on the 2017 to 2021 average to cover all REITs.
(c) b / a
(d) From 2017 to 2021 to cover all REITs.
(e) Based on the 2017 to 2021 average to cover all REIT
I used a simple Pass (denoted by 1 in the table) and Fail (indicated by a blank in the table) method for each REIT. The results are shown in the following table.

Three REITs passed all three criteria. They are ALAQR, ATRIUM, and KIPREIT. I am not suggesting that you invest in them. Instead, I am recommending them as candidates for further fundamental analysis.
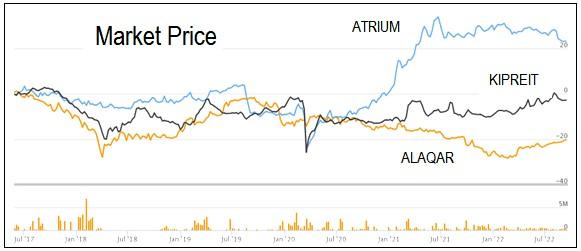
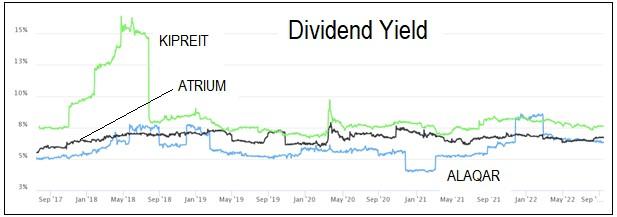
This requires you to look into the types of properties, the occupancies, and the tenants’ profiles. However, as a back-of-envelop test, I would look at the two standard investment metrics: capital gain and dividend yield. Of the three shortlisted REITs:
- ATRIUM had the best capital gain from 2017 to 2022, while you would have lost money with ALAQAR. Refer to Chart 132.
- In terms of dividend yield, KIPREIT had the best results from 2017 to 2022, while ALAQAR had the worst. Refer to Chart 13.
Based on these two metrics, I would investigate ATRIUM first.
Method
The base rates’ data were extracted from each REIT’s financial statements from 2007 to 2021 on TIKR.com. Note that these REITs had different financial year ends. I analysed two items:
- The average of the sector. This measures the central tendency. The mean is the most frequently used measure of central tendency because it uses all values in the data set to give you an average. For data from skewed distributions, the median is better than the mean because extremely large values do not influence it.
- The distribution of individual REITs makes up the panel. For this, I extracted the quartiles for each year based on the ranking of the respective metric.
In analysing a panel, you can use two perspectives: one is to look at the performance of the panel as a whole, and the other is to focus on the performance of the individual REITs.
Please read this article next: Should you rush to buy a property with inflation on the rise?
This article was originally published as Hunting for Bursa REITs to invest in by i4value.asia and is written by Dato Eu Hong Chew.