
The iProperty.com.my H1 2020 Portal Demand Analytics today revealed its demand-supply residential property report in Malaysia for the first half of 2020. The findings revealed the shifts in the local subsale property market and search trends following the COVID-19 outbreak. Also, find out the most in-demand neighbourhoods among home seekers that are ranked according to consumers’ visits data compiled from January to June 2020.
Note: To ensure that the demand data is of the highest quality, proper due diligence was conducted. This is on top of the certain measures that were put in place during the preparation of The iProperty.com.my H1 2020 Portal Demand Analytics. Please refer to the Notes section at the end of this article for more details.
The H1 2020 Portal Demand Analytics by iProperty.com.my provides an overview of the current demand trends in the Malaysian residential property market using the property portal’s user visits and property listings data.
As Malaysia’s number one property portal, iProperty.com.my garners millions of visits each month. These real-time behaviours indicate where the nation’s residential demand (unique visits to the site from consumers) in comparison to supply (property listings on iProperty.com.my) is leaning toward. The analysis aims to provide an insight for policymakers and property developers on Malaysian residential property preferences.
The report focuses on four main regions; Kuala Lumpur, Selangor, Penang, and Johor. In this article, we will share the following highlights from the report:
- National overview of the Malaysian housing market (subsale only)
- Change in demand and capital growth for states and capital cities in Malaysia
- 20 Most in-demand areas in Kuala Lumpur, Selangor, and Penang
- 15 Most in-demand areas in Johor
National overview: Housing demand held on amid global pandemic
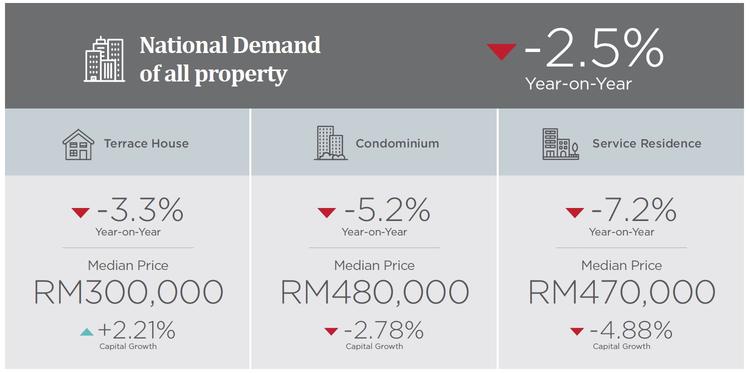
Overall, the H1 2020 national demand for property dipped by -2.5% due to a turbulent economic climate following the COVID-19 outbreak. Nevertheless, it is worth pointing -out that the effect of the pandemic on the property market is not as dire as what we initially thought it would be.
Even though both visits and listings took a significant dive following the implementation of the Movement Control Order (MCO), visits have since recovered following the implementation of the Conditional Movement Control Order (CMCO) in May when the movement restriction was gradually lifted. By the end of the first week of June, organic searches for sub-sale property listings saw an upward recovery of +41%. This growth is comparable to the 52-week pre-MCO average, allowing us to analyse our recovery using a one-year PRE-MCO benchmark.
Organic searches on the portal
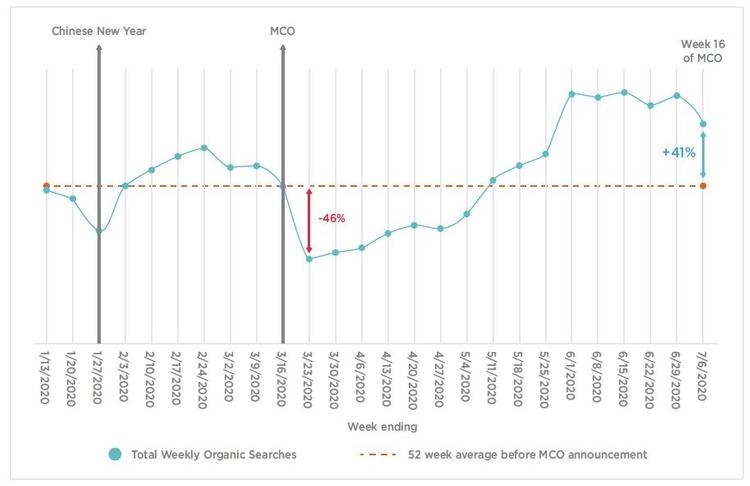
On top of that, it is also important to note the +41% jump began towards the end of May as the country moved into the Recovery Movement Control Order (RMCO). This phase helped cushion the initial impact of MCO on consumer sentiment. This demand surge softened the early shocks of COVID-19 in Q2 2020 and it is the main reason why the overall national property demand only decreased slightly by -2.5% in the first half of 2020.
Not just that, COVID-19 has also caused some shifts in the local property market. In some areas, the demand figure did not fluctuate much but property search trends have shifted to more affordable options such as flats or, in other areas, to homes with bigger layouts as more urban folks now have the option to work from home.
Compared to H1 2019 Portal Demand Analytics, the demand for all three housing types; terrace houses, condominiums, and serviced residences have dropped. The demands for service residences contracted sharply by -7.2% while demand for condominiums remained flat. Similarly, median prices and capital growths for these two property types have also plunged. The terrace home is also the only sub-category where the capital growth figure is in the positive territory, at +2.21%.
Selangor is the only major state with a positive residential property demand
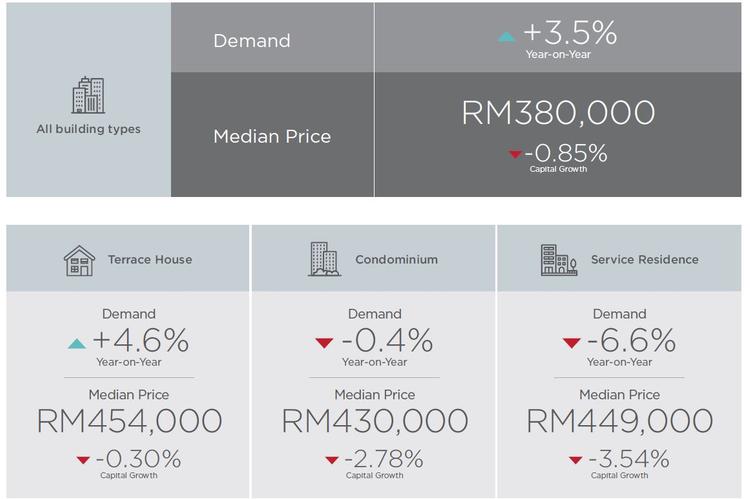
As we look extensively into the top four residential property markets in Malaysia – KL, Selangor, Penang, and Johor, the H1 2020 report reveals that Selangor is the only major state with a positive demand at +3.5% and with an overall increase in visits when compared year-on-year. The property demands in KL recorded only a marginal decline of -0.3% while the demand in Penang has declined by -6.5%. On the other hand, the property demand in Johor has remained subdued in H1 2020 as it was already sluggish even before the pandemic.
In Selangor, the work from home trend is encouraging homebuyers to explore areas further away from the city. The YoY demand for terrace houses in Selangor surged by +4.6%, and as we go in-depth later, the data also revealed that the top 20 most in-demand areas in Selangor are dominated by suburban townships.
As the pandemic reshapes the way we live and work in the short term, it has also shifted the housing demand trends; where people are seeking to migrate to smaller cities or suburban areas for a larger home and more comfortable living experience. However, whether or not this property search trend continues in the future needs to be monitored as the country gradually recovers from the pandemic spread in H2 2020.
Shah Alam is the only major city in Malaysia to record a positive residential property demand. Capital growth in major cities dropped
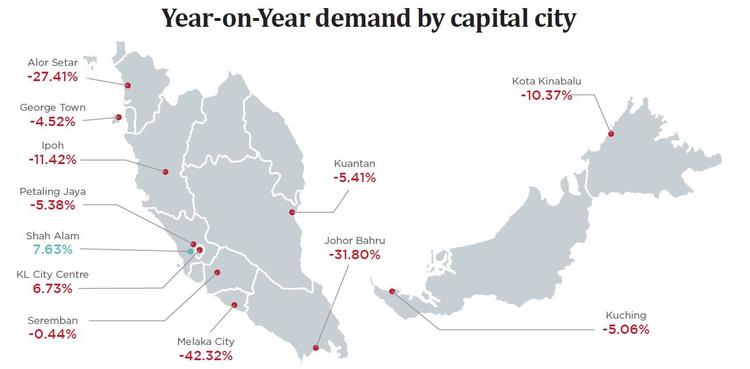
The capital state of Selangor, Shah Alam has come out of H1 2020 as the only major city in Malaysia to record a positive residential property demand where the figure stood at +7.63%. This is because properties in Shah Alam are still considered affordable as it is on the outskirts of Klang Valley. Housing demands may have shifted to smaller cities and suburban areas while the search for larger homes could have been sparked by the remote office working trend which started because of the MCO.
The data also revealed a drop in capital growth figures in the major cities for H1 2020. KL City Centre saw the biggest decline at -7.07%, followed by Georgetown with -5.42%, Petaling Jaya by -2.59%, Johor Bahru by -1.73%, and Shah Alam by -1.11%. This trend is expected as properties in prime city areas have premium prices and would be the first to take a hit when an extraordinary event such as the COVID-19 pandemic occurs.
20 Most in-demand areas in H1 2020 – KL, Selangor, and Penang
The areas below were ranked according to the area/property listings which garnered the highest number of unique visits from 1 January to 30 June 2020.
KUALA LUMPUR
- Batu Caves
- Taman Desa
- Setia Wangsa
- Damansara Heights
- Pantai
- Sentul
- Taman Tun Dr Ismail
- Seputeh
- Bangsar
- Sri Hartamas
- Desa Parkcity
- Setapak
- Wangsa Maju
- Bukit Jalil
- Sungai Besi
- Brickfields
- Sunway SPK
- Kuchai Lama
- Ampang Hilir
- Desa Petaling
Even though Batu Caves is officially a town within the Gombak district in Selangor, there are parts of it that intersect and fall in KL territory. Batu Caves regained the top spot for the most in-demand area in KL for H1 2020 after it slipped to the fifth position at the end of 2019. This was due to an increase in visitors who were looking at more affordable property options, specifically housing units which cost less than RM150,000.
SELANGOR
- Puncak Alam
- Dengkil
- Semenyih
- Cyberjaya
- Teluk Panglima Garang
- Gombak
- Kuala Selangor
- Glenmarie
- Sepang
- Setia Alam
- Damansara Perdana
- Bangi
- Banting
- Ara Damansara
- Sunway
- Mutiara Damansara
- Serendah
- Port Klang
- Petaling Jay
- Sungai Buloh
The top 20 most in-demand areas are dominated by suburban townships. Puncak Alam tops the chart with the number of visitors doubling year over year. Landed properties such as terrace houses and semi-Ds are seeing significant growth in the number of visitors. This is most likely due to the lower price tags of landed homes in the area, ranging between RM500,000 and RM1 million.
PENANG
- Kepala Batas
- Balik Pulau
- Seberang Jaya
- Simpang Ampat
- Bukit Mertajam
- Teluk Kumbar
- Butterworth
- Batu Maung
- Gelugor
- Perai
- Sungai Ara
- Bayan Lepas
- George Town
- Ayer Itam
- Batu Feringghi
- Bukit Jambul
- Juru
- Bayan Baru
- Sungai Dua
- Pulau Tikus
Apart from Gelugor, the ten most in-demand areas are dominated by neighbourhoods in the mainland area. Many opt to live out of the city centre, preferring a more affordable and sizeable living space in suburban areas. For instance, in Butterworth and Bukit Mertajam, visitors were looking at properties priced between RM300,000 to RM500,000 with built-up sizes ranging from 1,500 sq ft to 2,000 sq ft.
Kepala Batas recorded a nearly doubled number of visitors in H1 2020. Most of the visitors were interested in properties priced between RM400,000 to RM500,000 with a built-up area of 1,500 sq ft to 2,000 sq ft. In Gelugor, people were looking at service residences and condominiums with family-sized units while Gurney’s spike in demand was mainly driven by visitors looking at luxury condominiums priced at RM2.5 million.
15 Most in-demand areas in H1 2020 – Johor
JOHOR
- Batu Pahat
- Kluang
- Pasir Gudang
- Senai
- Kulai
- Permas Jaya
- Masai
- Gelang Patah
- Johor Bahru
- Iskandar Puteri (Nusajaya)
- Skudai
- Tampoi
- Perling
- Ulu Tiram
- Tebrau
Batu Pahat takes the crown for the most in-demand area in Johor. It has maintained its dominance in the 2019 Portal Demand Analytics despite the YoY demand going down by -34.26%. Also, the top 15 most in-demand areas in Johor for H1 2020 has received two new entries in the forms of Kluang and Iskandar Puteri, while Tampoi dropped off from the list. Kluang recorded an increase in demand by +19% while Iskandar Puteri has shown outstanding growth by +62.45%.
For more insights, you may check out the full report on our website. To download the full H1 2020 Portal Demand Analytics publication, click here.
NOTES
1) Considerations and measures put in place:
• Only areas that have more than 200 listings were selected to negate the effect of any spikes/big increases.
• Unique visits were used to prevent a single user from distorting the demand figures through multiple visits.
• In the case where a single user visits multiple areas, the visit is equally weighted across the multiple areas and building types to maintain the uniqueness of the user.
• All visits used in this report are based on organic and direct traffic only.
• Pricing is calculated for areas that have had at least 10 property transactions within one year.
• Median PSF is used to calculate capital growth due to various built-up sizes being transacted.
2) Definitions
• Unique Visit: Based on google analytics tracking of unique visitors, where multiple visits on the same listing by one visitor are counted as one.
• Active Property Listing: Property listings in iProperty that were active for at least one day and has a minimum of 1 view
• Property Demand: The number of unique user visits over the number of active property listing with views
• Organic / Direct Traffic: Based on google analytics tracking, organic and direct traffic is not obtained through paid services or other sites.