
| Items | 2020 Total Equity (USD mil) | 2020 Total Assets (USD mil) |
| Malaysia Large | 658 | 1,294 |
| Malaysia Medium | 122 | 229 |
| Malaysia Small | 26 | 63 |
| Evegrande | 53,863 | 352,517 |
Giant real estate developer Evergrande recently gained notoriety as China’s most debt-saddled property developer. It’s more than USD300 billion in debt has resulted in hundreds of unfinished projects and angry suppliers. Could there be an “Evergrande” in the Malaysian property market? Are there red flags that can be used to identify such a company?
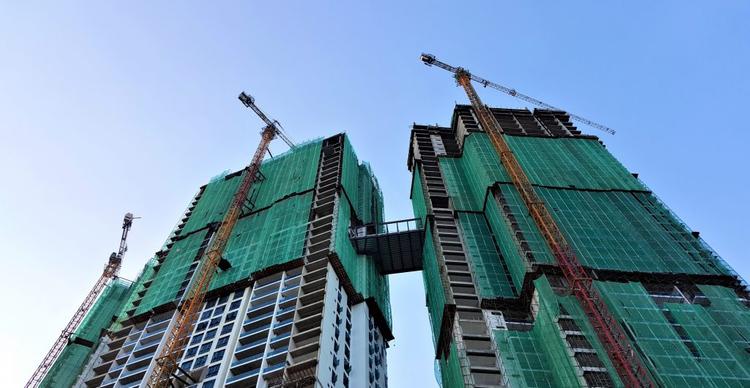
Evergrande, one of China’s largest real estate development companies, has gained infamy for becoming the country’s most indebted developer. With more than USD300 billion worth of liabilities, Evergrande is now expected to be one of the largest-ever restructurings exercises.
There are currently many analyses on why Evergrande is failing. If you were an investor or house buyer looking to buy or invest in Malaysian property, you would be better served if there were analyses that raised red flags years before problems set in.
I wanted to see if there were ratios and trends that could be used to identify a similarly problematic company. I started by reviewing the various reports on Evergrande carried out by analysts today to identify key issues faced by Evergrande.
I then tracked Evergrande’s performance from 2010 to 2020 and compared it with the performances of 85 companies under the Bursa Malaysia property sector. I have identified seven metrics that could be used as red flags. To be a potential Evergrande, a company’s performance must match or exceed Evergrande in all seven metrics.
None of the Malaysian property developers has an Evergrande-type of debt problem despite the soft property market and the pandemic measures. It indicates the industry is resilient. There are three companies that come close to meeting five or more of the metrics – this is expanded don in the conclusion section.
How did Evergrande get in trouble?
Evergrande’s problem is more about liquidity than solvency. It got into trouble because it funded its growth with debt. Yet while growing it had a declining return of investment. It did not help that it did not have a good track record of generating cash flow from operations.
Analysts attributed Evergrande’s problems to its huge debt, high inventory, spiking payables and poor cash generation. The charts and table below show Evergrande’s deteriorating position in these metrics.
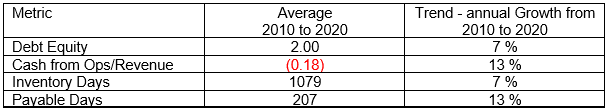
- Its debt to equity ratio was already at 1.46 in 2010 and increased to 2.24 by 2020.
- Evergrande only generated positive cash flow from operations for two out of the past 11 years. On a cumulative basis, the cash flow from operations was negative from 2010 to 2020.
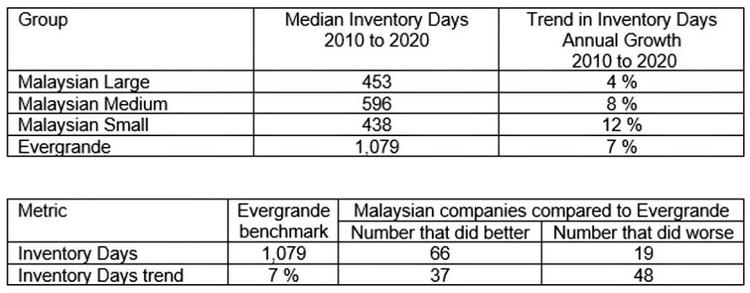
- Evergrande’s inventory in 2020 was 3½ years of revenue, having grown 7% annually
- In 2020, Evergrande’s payables were 1¼ years of revenue, having grown at 13% annually.
This is not even considering the off-balance sheet liabilities. At the same time, some of its payables are actually “disguised” debt. Worse still, while getting bigger, Evergrande’s returns and cash generation deteriorated.
- Evergrande’s ROE declined by about 13% annually. Its declining ROE was basically due to declining profit margins and asset turnover
- Cash flow from operations was negative in most years. The positive results in 2018 and 2020 appeared to be from changes in working capital
Given this picture, Evergrande’s current situation comes as no surprise. The problem was hidden when the Chinese property market was booming and credit was readily available. But when the property market softened, Evergrande’s liquidity problems came to the surface and was made worse when Chinese authorities also began to control borrowings.
See what others are reading:
 Commercial vs residential: Can I convert commercial title to residential title?
 Guaranteed rental return (GRR) properties: is it worth investing?
Benchmarking Malaysian property stocks against Evergrande

Malaysian property companies do not have the same size of revenue or profits as Evergrande. I had to scale the performance so that size does not matter. This was achieved by looking at ratios and indices.
I divided the Bursa Malaysia property development companies into three groups based on their total shareholders’ funds (SHF):
- Large – SHF greater than RM1 billion
- Medium – SHF between RM300 million and under RM1 billion
- Small – SHF less than RM300 million
I compared Evergrande’s performance against those of the three Malaysian property development groups. The performances of the three Malaysian groups were based on their respective averages. I carried out two types of analyses:
- Looking at the average and absolute values at a certain point in time
- Looking at trends, how the values changed from 2010 to 2020
Evergrande far outstripped any Malaysian property developer on total equity or total assets, as can be seen in the table below.
But size alone did not account for Evergrande’s current predicament. It is about how it grew to where it is today that mattered.
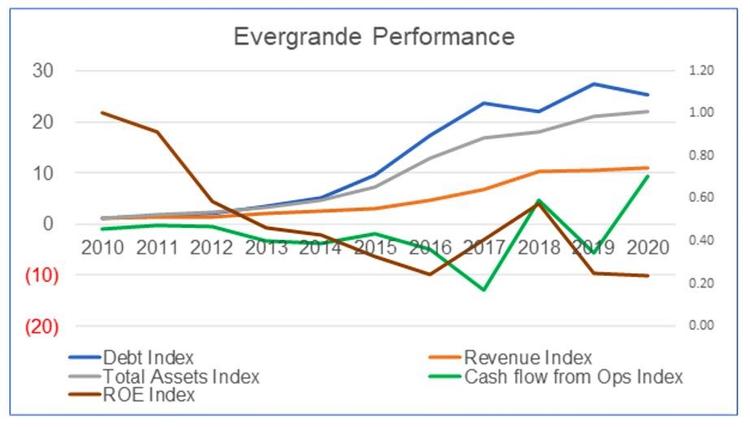
To illustrate these growth rates, I plotted the total equity and total assets indices for both. The index was constructed by comparing the value of each year by the respective value in 2010.
For example, the total equity of Evergrande was RMB21.37 billion in 2010 while in 2020, it was RMB350.43.
- The index for 2010 was 21.37 / 21.37 = 1.0
- The index for 2020 was 350.43 /21.37 = 16.4
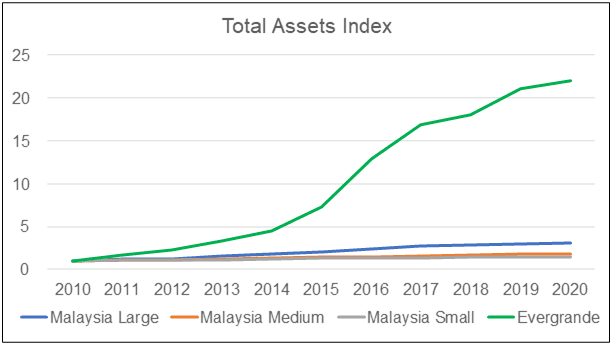
Evergrande’s phenomenal growth compared to its Malaysian counterparts can be seen in these Equity and Total Assets charts.
- From 2010 to 2020, Evergrande’s total equity and total assets grew at 22% and 24% respectively annually
- The three Malaysian property development groups did not even come close.
| Items | Trend in Equity Annual Growth 2010-2020 | Trend in Total Assets Annual Growth 2010-2020 |
| Malaysia Large | 11% | 11% |
| Malaysia Medium | 7% | 6% |
| Malaysia Small | 4% | 4% |
| Evegrande | 22% | 24% |
Note: There were some cases with negative values for the metrics. To cater for such cases, I computed the annual growth rate as the gradient of the best-fit line. This was then expressed as a percentage of the average values over the past 11 years.
But looking at individual Malaysian companies, about a dozen exceeded Evergrande’s growth rate.
| Metric | Evergrande Benchmark | Malaysian companies compared to Evergrande | |
| Number that did better | Number that did worse | ||
| Equity trend | 22% | 13 | 72 |
| Total assets trend | 24% | 12 | 73 |
Note: In this context, I considered a worse performance as a growth rate that was lower than that achieved by Evergrande
Benchmark 1: Debt
Evergrande had high debts. At the same time, it also had a high debt growth rate as shown in the Debt Index chart.
- Between 2010 to 2020, Evergrande’s debt grew by 24% annually
- There were 12 Malaysian companies with more than 24% annual growth in debt in the same period.
| Property Development Group | Trend in Debt Annual Growth 2010-2020 |
| Malaysia Large | 13% |
| Malaysia Medium | 3% |
| Malaysia Small | 8% |
| Evegrande | 24% |
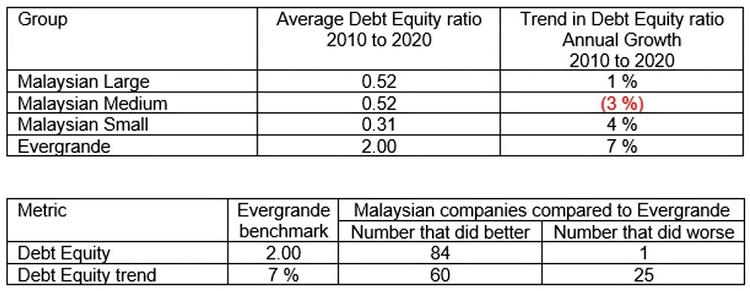
In terms of debt-equity, Evergrande had an average ratio of 2.0 for the period from 2010 to 2020.
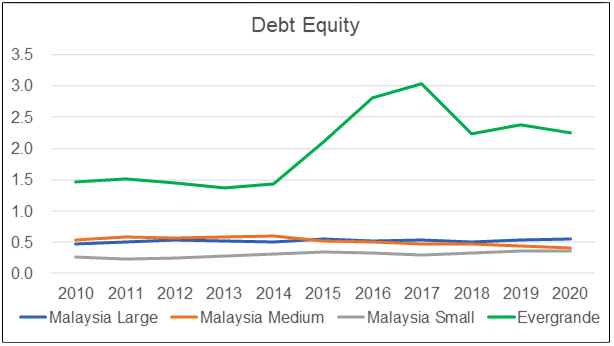
The Debt Equity table shows the debt to equity ratio for Evergrande had grown at 7% annually from 2010 to 2020.
A 7% annual growth was not exceptional as there were 25 Malaysian property development companies that exceeded this growth rate. The main difference was that none of the Malaysian companies had a debt to equity ratio of more than 1.00 in 2020.
Benchmark 2: Inventory
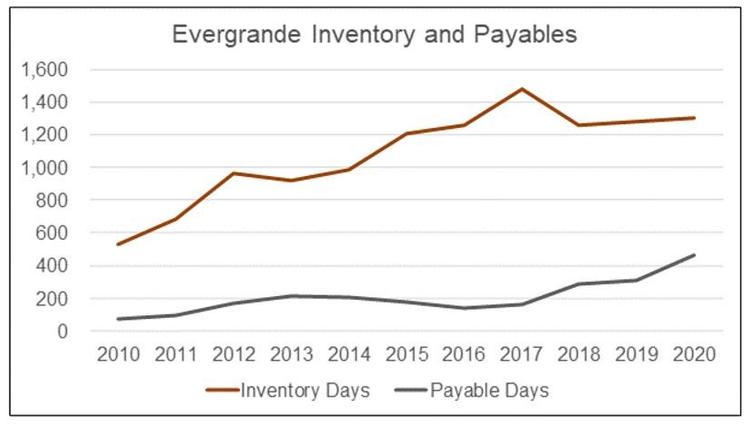
Several analysts had pointed out that one of Evergrande’s problems was the increasing level of unsold properties. To get an estimate of this, I plotted Evergrande’s inventory days. This represented the level of inventory relative to the revenue for the respective year.
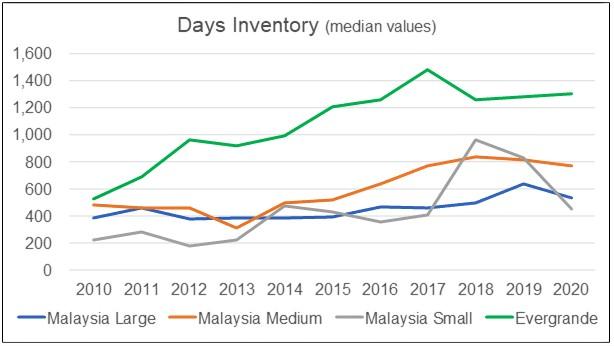
As can be seen from the Inventory chart, Evergrande had about 3.5 years of inventory for the past few years. This far exceeded the average of the three Malaysian property development groups.
One might think that Evergrande’s performance was bad. But there were 19 Malaysian companies whose average inventory days from 2010 to 2020 exceeded 1,079 days of inventory. And more than half of the Malaysian companies had an inventory days growth rate that exceeded that of Evergrande.
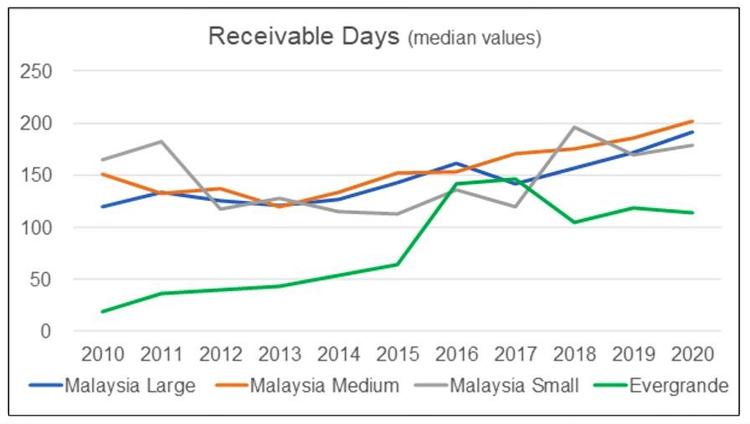
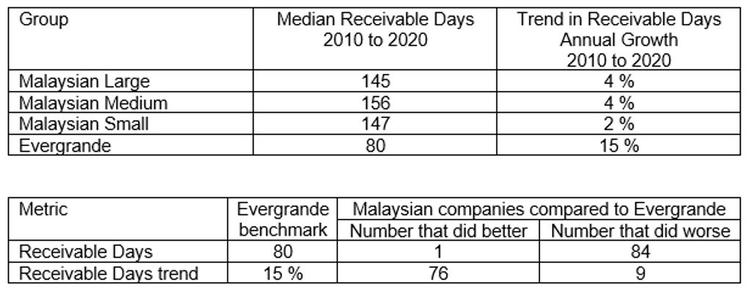
Benchmark 3: Receivables
Looking at the Receivable Days chart, Evergrande’s average performance from 2010 to 2020 was much lower than those of the Malaysian groups. I attribute this to the different marketing conditions between China and Malaysia.
However, when it came to changes in the receivable days, Evergrande’s growth was very much higher than those of the Malaysian property development groups. But there were nine Malaysian companies whose growth in receivable days exceeded that of Evergrande.
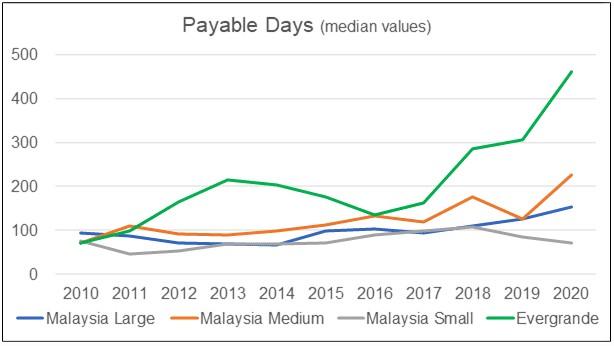
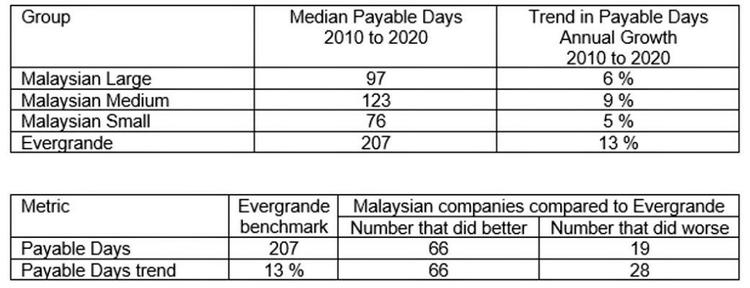
Benchmark 4: Payables
Evergrande payable days had also increased dramatically over the past few years, an indication that it was facing cash problems. But then, many Malaysian companies had higher payables days. Some had higher growth rates in the payable days.
CHECK OUT: Will Malaysia’s house price increase in 2021 amid COVID-19?
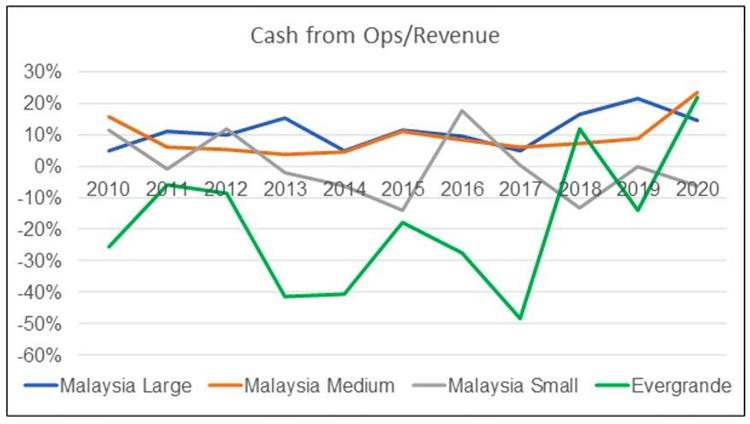
Benchmark 5: Cash from Ops
Evergrande had a poor track record in generating cash flow from operations. From 2010 to 2020, its cumulative cash flow from operations was negative. In fact, Evergrande only had two years of positive cash flow from operations between 2010 to 2020.
Do not be surprised to see that Evergrande’s cash flow from operations as a percentage of revenue were -18%. Compare this to the Malaysian property development groups which had a positive average cash flow from operations to revenue ratio.
Individually, there were 15 Malaysian companies whose cash flow from operations to revenue ratio were less than -18%. In other words, they were worse than Evergrande.
| Property Development Group | Average Cash from Ops/Revenue 2010-2020 |
| Malaysia Large | 11% |
| Malaysia Medium | 9% |
| Malaysia Small | 0% |
| Evegrande | (18%) |
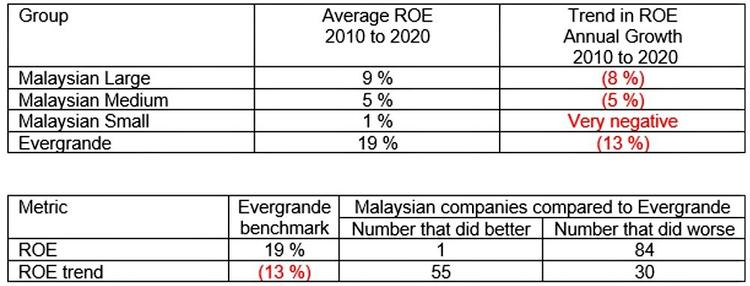
Benchmark 6: Returns

In terms of ROE, Evergrande outperformed the average ROE of the Malaysian property development groups.
- Evergrande had an average ROE of 19% from 2010 to 2020. Among the Malaysian property companies, the best average ROE was from the Large group (9%) in the same period
- One Malaysian company had an average ROE that exceeded 19% from 2010 to 2020.
Evergrande’s ROE had been declining since 2010 when it posted 38%. By 2020, it had shrunk to 9%, equal to an annual decline of 13%.
- There were 30 Malaysian companies whose ROE declined by more than 13% annually during the same period
- Fifteen Malaysian companies bucked the trend with increased ROE in 2020 compared to 2010. Do not confuse this with the 55 that did better than Evergrande as shown in the table. I define “better” as having a trend that is more than (13%). A negative trend of 5% is deemed better even though it is not positive growth.
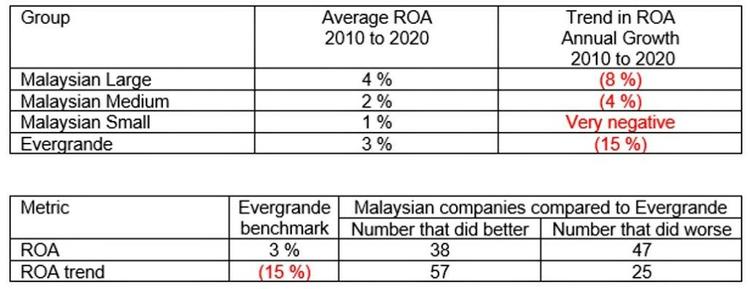
When it came to ROA, Evergrande’s return did not stand out. As can be seen, Evergrande only outperformed the average ROA of the Large Malaysian group in 2010 and 2011. In fact, for four years, even companies in the Medium Malaysian group posted ROAs that exceeded that of Evergrande.
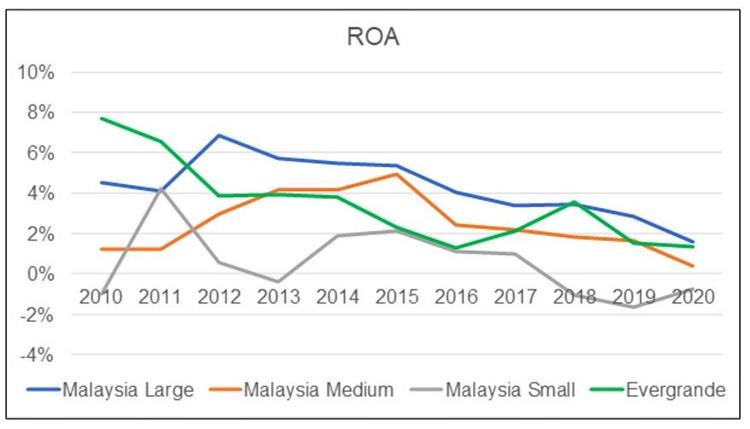
In terms of trend, Evergrande and the averages of the three Malaysian property development groups posted declining ROAs. However, 19 Malaysian companies bucked the trend with a greater ROA in 2020 than in 2010.
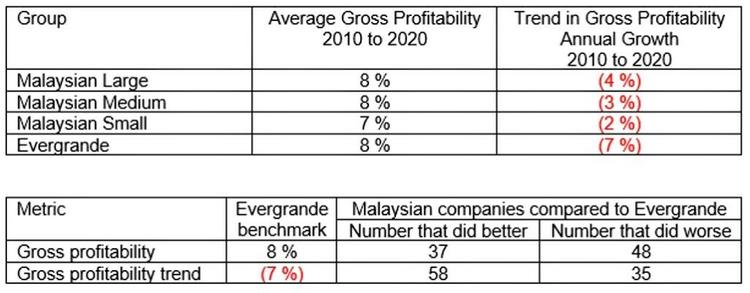
Benchmark 7: Gross profitability
Gross profitability is defined as gross profit divided by total assets.
Professor Robert Novy-Max of the University of Rochester has done considerable research into this metric. According to him, it has roughly the same power as book-to-market in predicting the cross-section of average returns.
I used it as an indicator of potential return.
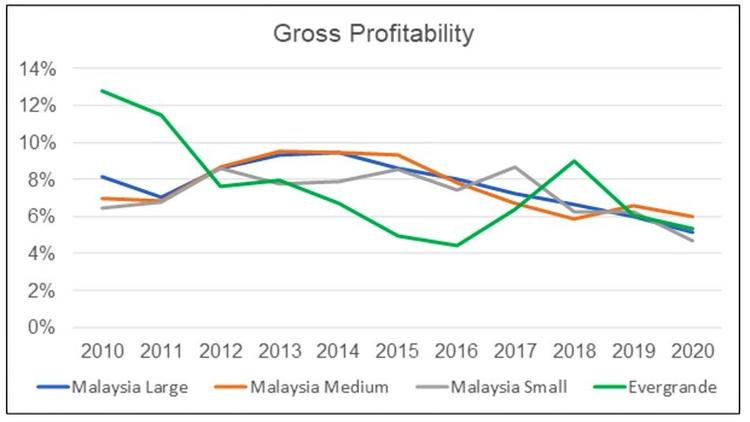
Evergrande’s performance did not stand out when compared to the Malaysian property development groups. Furthermore, Evergrande’s gross profitability had declined the most from 2010 to 2020. There were 33 Malaysian companies whose gross profitability had grown from 2010 to 2020.
Conclusion
Based on all the above, we can use the seven metrics to identify problematic property developers. The table below summarises the benchmark values/criteria for them.
| Metrics (a) | Average 2010-2020 | Annual Growth 2010-2020 |
| Debt Equity Ratio | >2.0 | >7% |
| Inventory Days | >1079 | >7% |
| Payable Days | >207 | >13% |
| Cash/Revenue | >0% | Not applicable |
To be an Evergrande, a Malaysian property developer must meet all seven benchmark values, which none of the 85 Bursa Malaysia property companies does.
However, 3 Bursa Malaysia property development companies met five or more of these seven metrics. Unlike Evergrande, the 3 Malaysian companies red-flagged did not have revenue growth. Their Inventory, Payables, and even Cash Flow problems can be attributed to the lack of revenue growth. Secondly, Evergrande’s liquidity problem was due to its high Debt levels with an average Debt Equity of 2.00. The 3 Malaysian companies’ average Debt Equity ratios are significantly less.
If these 3 companies with 5 to 6 red flags are also not likely to go Evergrande’s way, it reinforces the resilient picture. This is unlike the late 90s during the Asian Financial Crisis when several property companies had to be restructured. Despite the soft property market over the past few years as well as the MCO of 2020, I would conclude that the Malaysian property sector is resilient.
TOP ARTICLES JUST FOR YOU:
 Maybank Houzkey: An unintended financing scheme for investors?
 Land transfer procedure in Malaysia: Documents, costs, and everything you need to know
 What you should know about Amanah Saham Bumiputera (ASB) and Amanah Saham Malaysia (ASM)
This article was originally published as Is there an “Evergrande” among Bursa property stocks? by i4value.asia and is written by Dato Eu Hong Chew.
Disclaimer: The information is provided for general information only. iProperty.com Malaysia Sdn Bhd makes no representations or warranties in relation to the information, including but not limited to any representation or warranty as to the fitness for any particular purpose of the information to the fullest extent permitted by law. While every effort has been made to ensure that the information provided in this article is accurate, reliable, and complete as of the time of writing, the information provided in this article should not be relied upon to make any financial, investment, real estate or legal decisions. Additionally, the information should not substitute advice from a trained professional who can take into account your personal facts and circumstances, and we accept no liability if you use the information to form decisions.