
| House Price (RM) | Loan (90%) | Tenure (Years) | Monthly Instalment
[Market Interest Rate of 4.5%] | Sum of monthly debt (+RM1,000) | Minimum Average Household NET Income (RM)
[DSR = 70%] |
| 400,000 | 360,000 | 35 | RM 1,704 | RM 2,704 | *RM 3,863 |
| 500,000 | 450,000 | 35 | RM 2,130 | RM 3,130 | RM 4,471 |
| 600,000 | 540,000 | 35 | RM 2,556 | RM 3,556 | RM 5,080 |
| 700,000 | 630,000 | 35 | RM 2,982 | RM 3,982 | RM 5,689 |
This article was updated on 31 January 2020.
Check out our guide (which uses the Debt-to-service ratio rule) to determine which price range and residential neighbourhoods within Klang Valley that best suit your income level. Latest residential property transaction data included at the end!
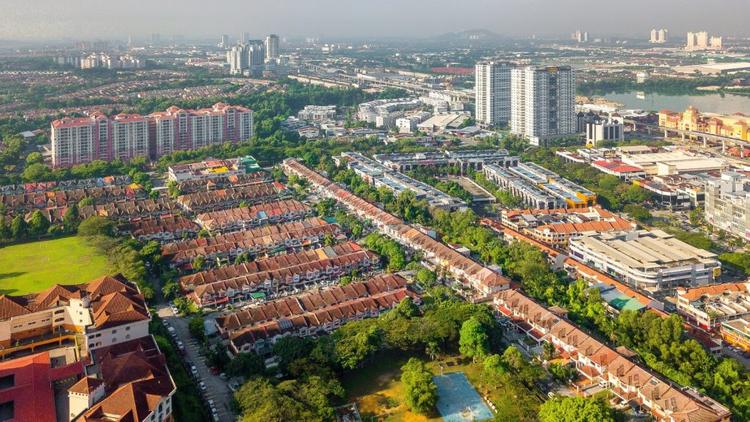
If you are looking to jump onto the property ladder this year, kudos to you! However, although you may think that you are financially ready to be a homeowner, do you know what kind of residential property and which price point you should be looking at? Determining your personal housing affordability isn’t always easy, as you will have to find the right balance between wants/needs and financial capability. Do you have the earning power to purchase a brand new condominium near the city centre? Or could you only afford a sub-sale apartment somewhere in Shah Alam?
Most importantly, how much cash would you need to buy a typical starter house within Klang Valley, which usually ranges between RM400,000 to RM700,00? Will your salary be able to finance the down payment and monthly repayments? Before you start surveying for your dream home, let’s take a look at your finances and gauge how much you can realistically pay.
READ: Latest stamp duty charges & 6 other costs to consider before buying a house in 2020
How ‘much’ house can your income afford?

When it comes to home purchasing, the general rule of thumb is that your Debt-to-service (DSR) ratio should not exceed 70%. The DSR percentage shows how much of your income is being used to pay off debt and if you can afford to take up the housing loan you have in mind. This formula is commonly used by banks to assess a borrower’s loan eligibility, i.e the ability to repay their monthly instalments, where
DSR = Debt/Net Income X 100
Debt refers to all existing financial obligations, such as credit card repayments, personal loans and student loans, whereas net income refers to your income after deductibles, such as income tax and EPF.
Most banks including Maybank and Public Bank have a DSR cap of 65-70%, so it is crucial that you calculate your repayment ability for your target home before making the next move. The last thing you want to be doing is to utilise your entire salary for housing expenses.
For instance, let’s assume your household income is RM5,000 per month (this could either be the salary of a single working professional or a double-income couple). After deducting EPF, income tax and SOCSO, your net income would amount to roughly RM4,300.
*According to the most recent data captured by the Department of Statistics Malaysia, the median household income in Selangor is RM7,225 but we decided to base our benchmark of RM5,000 on the national median of RM5,228 instead, to take into account that most first time homebuyers fall within the 25-35 age group and they do not have that much earning power yet.
Hence, in order to fulfil the minimum 70% DSR rule, your household’s total debt cannot exceed RM3,010.
DSR of 70%= RM3,010/RM4,300 X 100
Let’s say you have the following financial obligations. These estimates are loosely based on the average Malaysian millennial living in an urban area:
- Car loan: RM500
- Credit card repayments: RM400
- PTPTN Loan: RM100.
Other financial debt/obligations = RM1,000.
Therefore, for those with a gross household income of RM5,000 and net income of approximately RM4,300; when taking up housing loan, their monthly instalment figure must not be more than RM2,010.
Total Debt – Other financial debt = RM3,010 – RM1,000 = RM2,010
Read this first if you are planning to purchase a home with your partner.
Which price range should you be looking at?

Of course, the RM5,000 household income benchmark will only apply to a certain percentage of the population.
To help other potential buyers (with different household income points) figure out which property price range they should be targeting, we have created a table that details the estimated home loan repayments for the RM400,000 to RM700,000 price range, which is considered affordable to most first-time Malaysian home buyers AND based on the current market supply/new launches in the Klang Valley.
When calculating the minimum net income required for each price range, we ensured that the sum of current debt is RM1,000 (as exemplified above) and the monthly instalment figure does not exceed 70% of the net income stated in the last column.
* The calculations assume a 10% down payment and a 35-year loan tenure. We also utilised a home loan with a 4.5% interest. This rate was used as the average figure from current rates of home loan products available in the market at the moment.
*Using the 70% DSR rule, here is how we derived RM3,863.
Average Household NET Income of RM3,863 = 100/70 X RM2,704
Remember that the final sum displayed is of NET income (post-EPF, income tax and SOCSO payments). Do also take note that there are other expenses to consider when purchasing a house – these include legal fees, bank processing fees and insurance costs. It is imperative that you include all these complementary expenses into your budget before making a purchasing decision.
Looking for your dream home is tough, but forking out the initial 10% down payment is an even bigger headache, especially if you’ve just joined the workforce and don’t have significant savings. Nevertheless, there are plenty of alternatives out there which will support your homeownership dream, including utilising the monies from your EPF Account 2.
Now, where in Klang Valley can you afford a home?
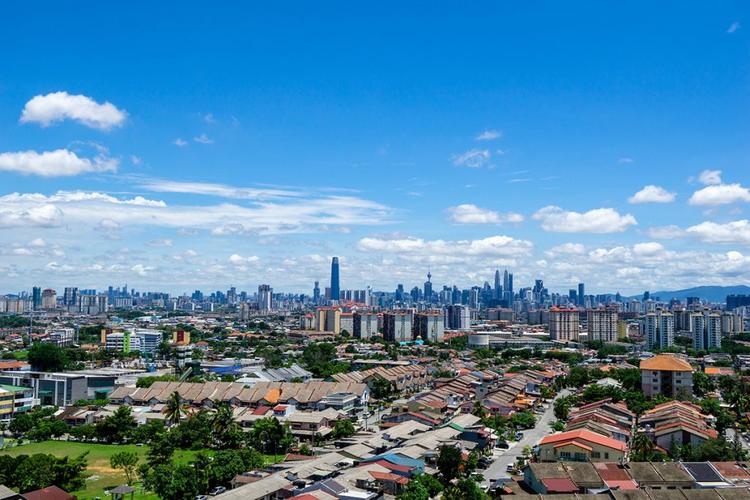
Now that you roughly know which price ranges you should be looking at, the next thing you would want to determine is which neighbourhood or area to be scouting out for your property. Ask any urbanite for their dream residential location, and most will quote a city centre address – surrounded by plenty of conveniences including public transportation links, popular restaurants, malls and entertainment outlets. The only roadblock is, of course, the hefty price tag.
Nevertheless, there are plenty of residential properties throughout various suburbs located on the city fringes. The upgrades in roads networks and rail transportation infrastructure in the past year or two have also contributed to more homes being supplied in the market.
CHECK OUT: 5 affordable properties in Klang Valley with easy access to LRT
In order to provide readers with an affordability benchmark for various areas, we have analysed the latest residential property transaction data captured by the Valuation and Property Services Department (JPPH), from June 2018 to May 2019. These sales figures are compiled and the median prices are calculated accordingly by iProperty.com’s big data solution, iPropertyiQ.com.
Here we share the median transacted prices for condominiums and serviced residences in Kuala Lumpur as well as terrace homes in Selangor. These presidential property types were the most popular housing products bought by homebuyers within the same review period.
In Kuala Lumpur, there were:
- 3,298 condominium unit sales (*110 were new launch units) – 39.5% of total residential transactions
- 1,498 serviced residences sales (*69 were new launch units) – 18% of total residential transactions
Meanwhile, in Selangor, terrace homes won by a landslide, recording:
- 15,656 terrace house sales (3,213 were new launch units) – 49.4% of total residential transactions
The areas below have had at least 10 property transactions within the one year – areas with less than 10 transactions were removed to avoid any median data distortion. And we have categorised the neighbourhoods according to the following three price tiers for your easy viewing:
Green: ≤RM500,000
Orange : RM500,001 – RM700,000
Red: >RM700,001
Transacted Median Price for Condominiums in KL (June 2018 – May 2019)
| AREA | MEDIAN PRICE (RM) | MEDIAN PSF(RM) |
| AMPANG | 1,340,000 | 655 |
| BANDAR MENJALARA | 450,000 | 441 |
| BANGSAR | 1,180,000 | 815 |
| BATU CAVES | 390,000 | 335 |
| BRICKFIELDS | 780,000 | 560 |
| BUKIT JALIL | 600,000 | 502 |
| BUKIT TUNKU | 1,550,000 | 682 |
| CHERAS | 400,000 | 397 |
| DAMANSARA HEIGHTS | 1,088,000 | 712 |
| DESA PARKCITY | 1,165,000 | 842 |
| DESA PETALING | 355,000 | 338 |
| DUTAMAS | 600,000 | 437 |
| JALAN IPOH | 465,000 | 383 |
| JALAN KUCHING | 490,000 | 428 |
| KAMPUNG KERINCHI (BANGSAR SOUTH) | 1,125,000 | 608 |
| KEPONG | 475,000 | 452 |
| KERAMAT | 600,000 | 474 |
| KL CITY CENTRE | 1,000,000 | 604 |
| KL SENTRAL | 1,100,000 | 820 |
| KUCHAI LAMA | 446,500 | 385 |
| MONT KIARA | 1,515,000 | 704 |
| OLD KLANG ROAD | 610,000 | 468 |
| PANTAI | 442,500 | 416 |
| SEGAMBUT | 685,000 | 573 |
| SENTUL | 580,000 | 481 |
| SETAPAK | 497,500 | 364 |
| SRI HARTAMAS | 2,350,000 | 738 |
| SRI PETALING | 410,000 | 368 |
| SUNGAI BESI | 532,500 | 499 |
| TAMAN DESA | 500,000 | 446 |
| TAMAN TUN DR ISMAIL | 795,000 | 597 |
| TITIWANGSA | 540,000 | 470 |
| WANGSA MAJU | 484,000 | 388 |
© brickz.my / JPPH
Check out subsale condominiums for sale in Kuala Lumpur here.
Transacted Median Price for Serviced Residences in Kuala Lumpur (June 2018 – May 2019)
| AREA | MEDIAN PRICE (RM) | MEDIAN PSF (RM) |
| AMPANG | 606,500 | 702 |
| BANDAR MENJALARA | 350,000 | 418 |
| BANGSAR | 612,500 | 1,143 |
| BATU CAVES | 550,000 | 609 |
| BUKIT JALIL | 838,000 | 794 |
| CHERAS | 490,000 | 581 |
| DAMANSARA HEIGHTS | 475,000 | 646 |
| DUTAMAS | 983,000 | 874 |
| JALAN IPOH | 450,000 | 445 |
| JALAN KUCHING | 500,000 | 491 |
| KAMPUNG KERINCHI (BANGSAR SOUTH) | 605,000 | 854 |
| KEPONG | 505,000 | 472 |
| KL CITY CENTRE | 1,000,000 | 1,075 |
| KL SENTRAL | 1,833,125 | 1,290 |
| KUCHAI LAMA | 445,000 | 486 |
| MID VALLEY CITY | 1,373,500 | 982 |
| MONT KIARA | 820,000 | 996 |
| OLD KLANG ROAD | 450,000 | 522 |
| SALAK SOUTH | 552,470 | 605 |
| SENTUL | 387,500 | 392 |
| SEPUTEH | 505,000 | 678 |
| SETAPAK | 498,000 | 489 |
| SRI HARTAMAS | 420,000 | 752 |
| TAMAN TUN DR ISMAIL | 1,260,000 | 969 |
| TITIWANGSA | 964,444 | 912 |
| WANGSA MAJU | 513,000 | 665 |
© brickz.my / JPPH
Transacted Median Price for Terrace Houses in Selangor (June 2018 – May 2019)
| AREA | MEDIAN PRICE (RM) | MEDIAN PSF (RM) |
| AMPANG | 500,000 | 499 |
| ARA DAMANSARA | 1,244,000 | 648 |
| BALAKONG | 490,000 | 409 |
| BANDAR KINRARA | 730,000 | 538 |
| BANDAR SRI DAMANSARA | 895,000 | 733 |
| BANDAR UTAMA | 1,277,500 | 658 |
| BANGI | 480,000 | 370 |
| BANTING | 268,800 | 272 |
| BATANG KALI | 202,500 | 229 |
| BATU ARANG | 220,000 | 264 |
| BATU CAVES | 440,000 | 429 |
| BERANANG | 544,900 | 353 |
| BESTARI JAYA | 150,000 | 183 |
| BUKIT RAJA | 780,000 | 381 |
| CHERAS | 506,500 | 414 |
| CYBERJAYA | 971,500 | 431 |
| DAMANSARA DAMAI | 875,000 | 594 |
| DENGKIL | 532,774 | 337 |
| GLENMARIE | 1,780,000 | 552 |
| IJOK | 474,670 | 342 |
| JENJAROM | 521,000 | 305 |
| JERAM | 145,000 | 207 |
| KAJANG | 450,000 | 359 |
| KAPAR | 380,000 | 336 |
| KEPONG | 550,000 | 473 |
| KLANG | 400,000 | 348 |
| KOTA DAMANSARA | 890,000 | 505 |
| KUALA KUBU BHARU | 115,000 | 164 |
| KUALA SELANGOR | 329,000 | 268 |
| PANDAMARAN | 550,000 | 358 |
| PASIR PANJANG | 250,000 | 265 |
| PETALING JAYA | 795,000 | 589 |
| PORT KLANG | 315,000 | 263 |
| PUCHONG | 680,000 | 451 |
| PUNCAK ALAM | 430,000 | 376 |
| RAWANG | 448,000 | 330 |
| SABAK BERNAM | 216,000 | 216 |
| SAUJANA UTAMA | 403,800 | 306 |
| SELAYANG | 555,000 | 439 |
| SEMENYIH | 565,000 | 345 |
| SEPANG | 337,500 | 279 |
| SERENDAH | 217,000 | 237 |
| SERI KEMBANGAN | 500,000 | 415 |
| SETIA ALAM | 614,000 | 426 |
| SHAH ALAM | 649,300 | 406 |
| SUBANG JAYA | 738,000 | 551 |
| SUNGAI BESAR | 250,000 | 194 |
| SUNGAI BULOH | 500,000 | 387 |
| SUNGAI LONG | 600,000 | 364 |
| SUNWAY | 660,000 | 552 |
| TANJONG DUABELAS | 360,000 | 357 |
| TANJONG KARANG | 290,000 | 237 |
| TANJONG SEPAT | 180,000 | 257 |
| TELUK PANGLIMA GARANG | 330,000 | 337 |
| UJONG PERMATANG | 239,000 | 206 |
| ULU BERNAM | 175,000 | 192 |
| ULU KELANG | 600,000 | 443 |
| ULU LANGAT | 480,000 | 428 |
| ULU YAM | 409,200 | 238 |
© brickz.my / JPPH
So, upon calculating your DSR to determine the corresponding property price that is affordable for you, you can now narrow down your home search according to the property type and location. For instance, if you are looking for a condominium below RM500,000, then you should be looking at areas such as Cheras, Kepong and Setapak. Those with a higher budget can scope out condominium units or serviced residences in neighbourhoods such as Bukit Jalil, Dutamas and Titiwangsa.
Alternatively, you can still purchase a terrace house for below RM500,000 in these areas – Batu Caves, Sungai Buloh and Ampang; or for not more than RM700,000 in suburbs like Dengkil, Kepong and Puchong. Ultimately, it all depends on your financial capability. Check out our Buying Guides for more homebuying tips and insights.
All the best and happy home hunting!
*NOTE: The new launch sale figure for high rise residential properties does not represent the whole market’s activity as it takes up to three years for such a sale to be recorded by JPPH – a sale is only recorded once the stamp duty on the Memorandum of Transfer (MOT) is paid. This sum can only be paid once the property’s strata title is issued; for high rise residential properties, the issuance of strata titles is considerable longer than landed homes, which is almost immediate as the landed units have already been broken down to its respective lots.
Disclaimer: The information is provided for general information only. iProperty.com Malaysia Sdn Bhd makes no representations or warranties in relation to the information, including but not limited to any representation or warranty as to the fitness for any particular purpose of the information to the fullest extent permitted by law. While every effort has been made to ensure that the information provided in this article is accurate, reliable, and complete as of the time of writing, the information provided in this article should not be relied upon to make any financial, investment, real estate or legal decisions. Additionally, the information should not substitute advice from a trained professional who can take into account your personal facts and circumstances, and we accept no liability if you use the information to form decisions.