
The iProperty.com.my H1 2021 Portal Demand Analytics (Residential Rental Market) revealed the rental demand data for Malaysia’s top four residential rental property markets — KL, Selangor, Penang, and Johor. The publication also disclosed the shift in rental demand during the second year of the pandemic and the most in-demand locations among rental property seekers, according to consumers’ visit data compiled from January to June 2021.
Note: To ensure that the demand data is of the highest quality, proper due diligence was conducted. This is on top of measures that were put in place during the preparation of H1 2021 Portal Demand Analytics (Rental Market). Please refer to the Notes section at the end of this article for more details.
iProperty.com.my garners millions of visits each month and these real-time behaviours pinpoint Malaysia’s residential rental property demand (represented by user visits to the site) in comparison to property supply (represented by residential property listings on our site).
In this third instalment of the Portal Demand Analytics (Residential Rental Market), we have shifted from using transacted prices (this metric was used in previous publications) to asking prices. We have introduced this change to provide more insight into the renter’s side of the equation. The asking rental prices listed in this publication represent active rental property listings on iProperty.com.my.
In this article, we will share the following highlights from the report:
- National overview of the rental market in Malaysia
- Changes and shifts in demand for major states and capital cities in Malaysia
- 20 Most in-demand areas in Kuala Lumpur
- 20 Most in-demand areas in Selangor
- 15 Most in-demand areas Penang
- 10 Most in-demand areas in Johor
National overview: Demand for landed properties sees a significant increase
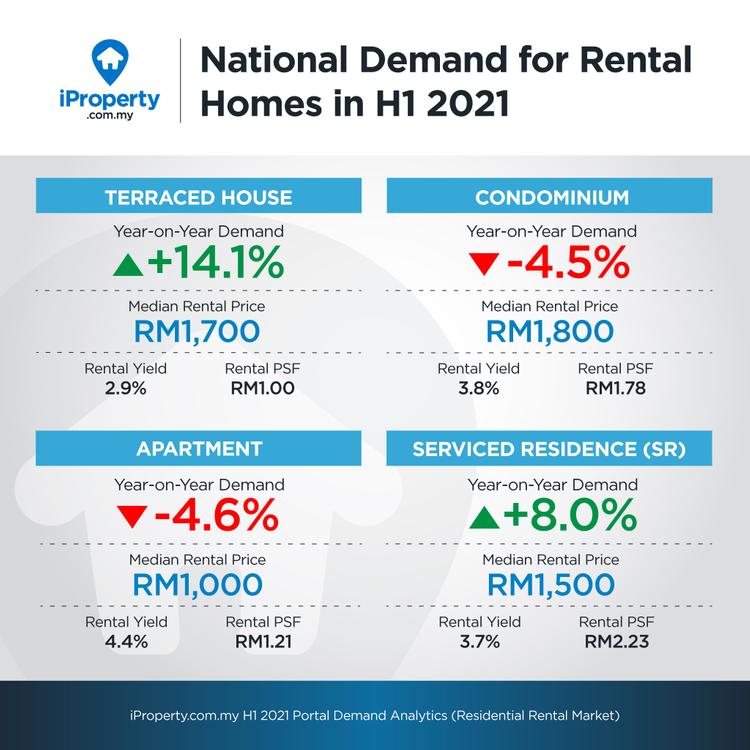
In H1 2021, the year-on-year (YoY) national residential rental demand in Malaysia increased from -5.6% to +1.9%, The positive jump is fueled by a surge in YoY demand for terrace homes at +14.1%.
As lockdown restrictions eased, demand for rental properties in KL and Penang began to rise. Areas that experienced double-digit YoY demand growth include Mont Kiara, Mid Valley City, KL City Centre, Pulau Tikus, George Town, and Bukit Mertajam.
However, rental yields across all residential building types suffered a dip in H1 2021. Asking rental prices continued to drop compared to asking sale prices, reducing rental yield figures. The rental yield for terraced houses decreased to +2.9% from +3.3% in H1 2020. Meanwhile, the rental yield for condominiums and serviced residences declined by 0.3% and 0.2% respectively.
Read more: (UPDATED SEPT 2021) Top 10 property developers in Malaysia
Rental prices in Kuala Lumpur dropped
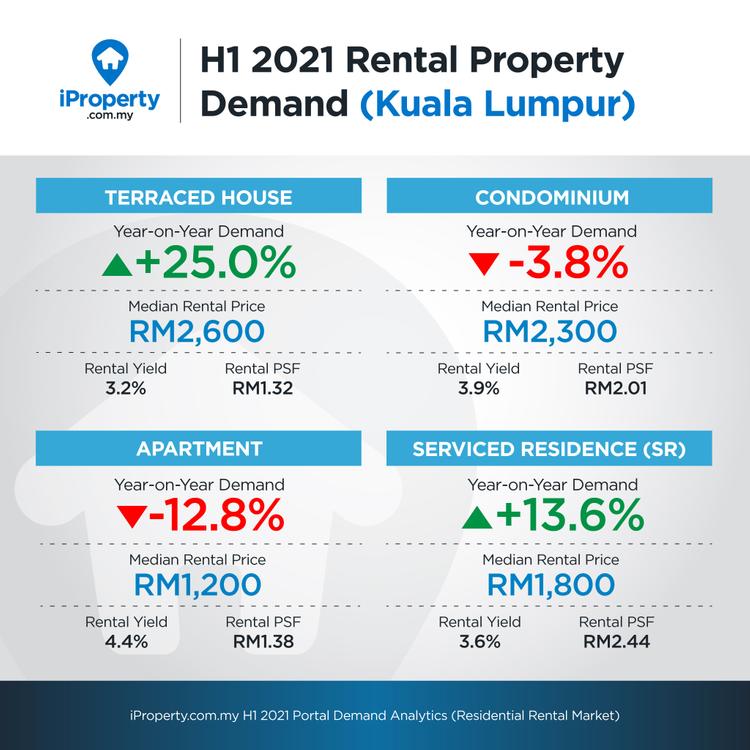
In Kuala Lumpur, the median rental price dropped to +13% from RM2,300 to RM2,000, while rental demand has improved from -2.9% in H1 2020 to +2.6% in H1 2021. With a high unemployment rate in the country, many have opted to rent instead of committing to a home purchase.
Condominiums and serviced residences between 1,000 to 1,200 sq. ft. with a price range of RM1,500 to RM2,000 are highly favourable amongst renters. Apartment units sized 700 to 1,000 sq. ft. which cost RM1,000 to RM1,500 are also popular.
Meanwhile, affluent suburbs in Kuala Lumpur — Mont Kiara, Bangsar, Desa ParkCity, KL Sentral, and Sri Hartamas — are also seeing growth in rental demand and are generating prices above the city’s median price of RM2,000.
Strong demand for terrace houses in Selangor
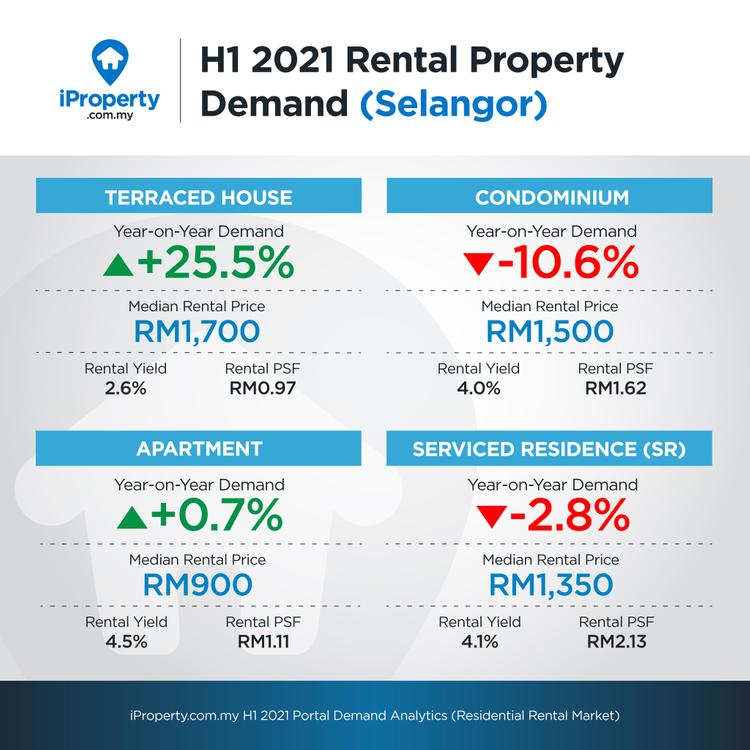
In H1 2021, Selangor was the only major state to record a decline in overall rental demand — the YoY drop of -1.0% is attributed to an increase in property listings which surpassed the rise in user visits.
Based on the National Property Information Centre (NAPIC)’s Q2 2021 data, condominiums and serviced residences account for the highest number of overhang properties (more supply of properties than demand) at 2,019 units and 2,025 units respectively. These two property types also saw a decrease in rental prices — condominiums dropped from RM1,600 to RM1,500 and serviced residences dropped from RM1,500 to RM1,350.
Conversely, rental prices for terrace houses held steady at RM1,700, in line with a strong YoY demand of 25.5%. In the top two residential areas, Rawang and Tanjong Duabelas. Many visitors were looking at terrace houses 1,500 – 2,000 sq ft and priced from RM1,000 to RM1,500.
Penang recorded the lowest YoY rental yield in Malaysia but still steady at +3.3%
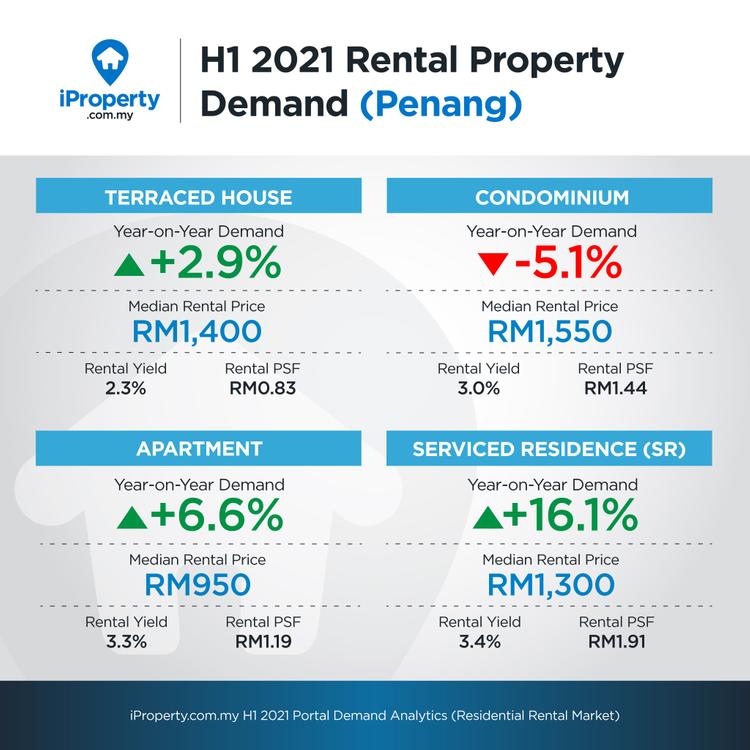
After a double-digit dip of -13.7% last year, Penang bounced back and registered a +1.8% YoY growth. However, condominiums still registered a negative YoY demand at -5.1% as the increase in property listings far surpassed the increase in user visits. According to NAPIC, as of Q2 2021, Penang has a significant condominium overhang, topping 4,163 units.
The state’s median rental dropped by RM100 to RM1,400 with serviced residences taking the biggest hit, declining from RM2,500 in H1 2020 to RM1,300 in H1 2021. This significant drop in pricing is due to the dwindling supply of serviced residences on the island and an increase in units on the mainland. In fact, rental prices for high-rise units on the mainland increased as manufacturing industries were allowed to operate in H1 2021.
Read more: HOC 2020: 5 properties to look out for in Penang
Significant increase in rental demand in Johor, spurred by interest in high-rise units
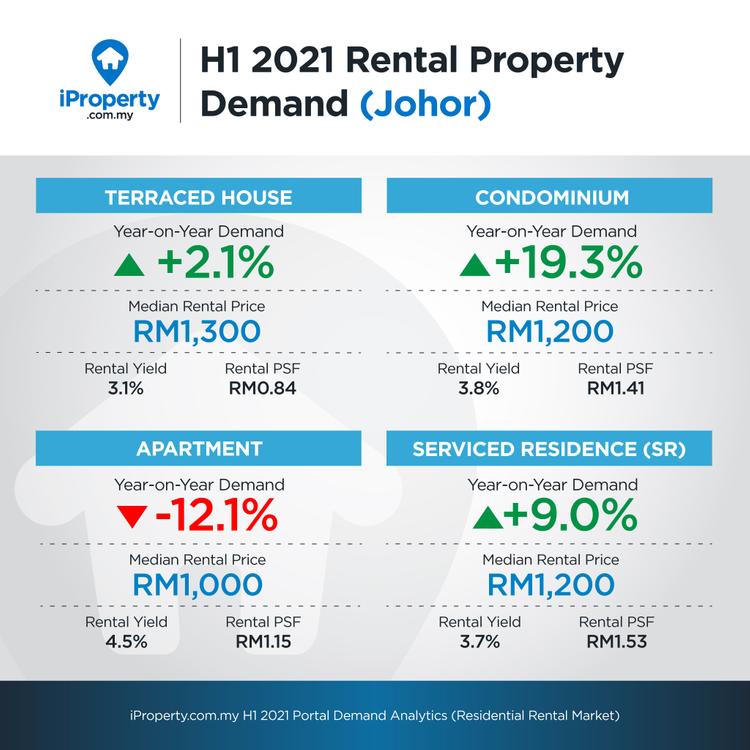
Johor saw a significant jump in rental property demand from -19.5% in H1 2020 to +6.6% in H1 2021. Median rental prices have gone down by RM200 to RM1,200. The decline was contributed by the dip in prices in condominiums and serviced residences — both experienced an RM300 price slump in H1 2021.
Johor still has the highest number of overhang properties in Malaysia. According to data from NAPIC, there are 6,661 units of unsold residential properties as of Q2 2021, and the oversupply situation is unlikely to change until the border with Singapore reopens. But, It is worth noting that the percentage of renters in Johor Bahru District has increased from 23.4% in 2014 to 28.4% in 2019, according to the Department of Statistics.
Next, let’s look at the most in-demand areas across the four major states in Malaysia. These areas were ranked according to the area/property listings which garnered the highest number of unique visits from 1 January to 30 June 2021.
Top 20 in-demand areas in Kuala Lumpur
- Damansara Heights
- Pantai
- Bangsar
- Taman Tun Dr Ismail
- KL Sentral
- Mid Valley City
- Taman Desa
- Bukit Jalil
- Wangsa Maju
- Seputeh
- Sri Hartamas
- Sentul
- Desa ParkCity
- Cheras
- Old Klang Road
- Sungai Besi
- Sri Petaling
- Brickfields
- Jalan Ipoh
- Ampang
In Damansara Heights, visitors were interested in bungalows and semi-Ds priced above RM5,000 and with sizes exceeding 3,000 sq ft. Meanwhile, in Pantai, condominiums and serviced residences priced between RM2,500 – RM5,000 with sizes that range from 1,000 sq ft to 1500 sq ft were the most popular choices amongst rental property seekers.
Top 20 in-demand areas in Selangor
- Rawang
- Setia Alam
- Sunway
- Klang
- Bangi
- Tanjong Duabelas
- Semenyih
- Damansara Perdana
- Shah Alam
- Subang Jaya
- Petaling Jaya
- Selayang
- Damansara Damai
- Kajang
- Glenmarie
- Ara Damansara
- Ampang
- Cyberjaya
- Sungai Buloh
- Batu Caves
In H1 2021, Bangi lost its coveted top spot. This was due to an influx of condominiums and serviced residences in the local market which caused demand to drop by -21% YoY. Rawang on the other hand, ascended to the top spot with the highest YoY growth in demand (+57%). Unlike Bangi, property listings in Rawang decreased but user visits increased significantly.
Top 15 in-demand areas in Penang
- Simpang Ampat
- Bukit Mertajam
- Perai
- Ayer Itam
- Sungai Dua
- George Town
- Butterworth
- Bayan Baru
- Sungai Ara
- Jelutong
- Bayan Lepas
- Pulau Tikus
- Batu Ferringhi
- Gelugor
- Tanjung Bungah
Many site visitors were interested in condominiums and serviced residences in Simpang Ampat priced between RM700 to RM1,000 with built-up sizes between 700 sq ft to 1000 sq ft. In Bukit Mertajam, people were browsing for apartments, serviced residences, and terrace homes priced between RM700 to RM1,000 and sized from 1,000 sq ft to 1,250 sq ft.
Top 10 in-demand areas in Johor
- Pasir Gudang
- Ulu Tiram
- Kulai
- Gelang Patah
- Masai
- Skudai
- Johor Bahru
- Tampoi
- Permas Jaya
- Iskandar Puteri (Nusajaya)
The most favoured rental price range for terrace homes in Pasir Gudang is between RM1,000 to RM1,500 for units between 1500 sq ft to 2000 sq ft. Whereas visitors in Ulu Tiram were looking at apartments with built-up sizes between 700 sq ft to 1,000 sq ft and with price tags of between RM700 to RM1,000, as well as terrace houses measuring 1,500 to 2,000 sq ft in size within the RM1,000 to RM1,500 price range.
For more insights, check out the full report on our website. To download the full H1 2021 Portal Demand Analytics publication, click here.
NOTES:
- The asking prices in this report are based on asking prices on property listings available on iProperty.com.my only. It is not a representation of the overall subsale residential market in Malaysia. The asking prices on iProperty.com.my are provided by the respective property seller/owner.
- Considerations and measures put in place:
- Only areas that have more than 350 listings were selected to negate the effect of any spikes/big increases.
- Unique visits were used to prevent a single user from distorting the demand figures through multiple visits.
- In cases where a single user visits multiple areas, the visit is equally weighted across multiple areas and building types to maintain the uniqueness of the user.
- All visits used in this report are based on organic and direct traffic only.
- Median Asking Price per Square Feet (PSF) is used to calculate Asking Price Change, due to various built-up size properties being listed.