
| LOCATION |
YEAR | |||||||||
| 2010 | 2011 | 2012 | 2013 | 2014 | 2015 | 2016 | 2017 | 2018 | 1H2019 | |
| Malaysia | 45.7 | 46.3 | 47.7 | 36.3 | 45.4 | 42.1 | 31.4 | 32.6 | 34.6 | 30.9 |
| Kuala Lumpur | 38.4 | 52.8 | 59.5 | 9.5 | 47.0 | 45.0 | 27.3 | 19.5 | 29.8 | 44.2 |
| Selangor | 47.0 | 46.0 | 49.2 | 49.2 | 48.5 | 33.3 | 35.6 | 45.1 | 44.6 | 33.2 |
| Johor | 42.5 | 42.3 | 43.6 | 28.7 | 36.4 | 36.6 | 29.8 | 44.2 | 45.5 | 42.0 |
| Penang | 47.9 | 25.1 | 56.5 | 31.2 | 43.9 | 48.2 | 9.9 | 39.0 | 7.0 | 16.4 |
| Perak | 56.6 | 44.1 | 44.8 | 40.5 | 48.8 | 41.4 | 37.1 | 45.8 | 37.5 | 15.4 |
| Negeri Sembilan | 49.8 | 51.2 | 49.2 | 41.5 | 60.0 | 61.5 | 46.9 | 30.3 | 44.7 | 38.1 |
| Melaka | 32.7 | 69.0 | 50.7 | 26.5 | 52.1 | 70.5 | 44.3 | 50.0 | 37.5 | 42.7 |
| Kedah | 30.6 | 37.6 | 28.0 | 46.5 | 41.1 | 36.2 | 11.1 | 39.4 | 22.1 | 16.0 |
| Pahang | 58.7 | 59.6 | 44.0 | 53.2 | 51.7 | 45.8 | 49.6 | 38.1 | 39.9 | 39.9 |
| Terengganu | 30.0 | 45.7 | 47.3 | 15.3 | 36.0 | 38.4 | 26.0 | 24.4 | 47.7 | 19.6 |
| Kelantan | 46.5 | 48.7 | 49.9 | 26.3 | 67.2 | 39.4 | 29.4 | 8.7 | 30.5 | 73.3 |
| Perlis | 48.9 | 50.0 | 16.7 | 34.9 | 28.3 | 36.8 | 91.7 | 58.4 | 5.7 | 37.5 |
| Sabah | 45.4 | 47.0 | 44.9 | 40.0 | 57.9 | 42.8 | 58.5 | 13.1 | 4.0 | 94.8 |
| Sarawak | 42.3 | 48.1 | 44.6 | 33.7 | 30.7 | 18.6 | 15.1 | 31.9 | 25.2 | 4.5 |
The severe glut in the property market has reached an all-time high. We studied the past years’ data to figure out exactly what needs to be done to rectify this issue.

As with many other countries in the world, housing affordability always remains the hottest topic of discussion in Malaysia. As reported by Bank Negara Malaysia (BNM) time and time again, houses nationwide are “seriously unaffordable”. As of 2016, house prices are 4.8 times the average Malaysian household’s annual income – which is more than the house price-to-income ratio of 3.0 as set by the median multiple methodology developed by Demographia International and recommended by the World Bank.
Various efforts have been put forward by the government to make homeownership more accessible, such as the building of one million affordable houses within the next 10 years, spearheading the Home Ownership Campaign (HOC) in 2019, launching the Affordable Housing Fund with the cooperation of BNM, introducing the Rent-to-Own (RTO) scheme, and extending the Youth Housing Scheme to December 2021.
Among these initiatives, HOC is particularly aimed to help alleviate the glut of unsold properties in the market, besides assisting aspiring homebuyers in securing a home at a lower entry cost. The campaign which was initially targeted to run for the first 6 months of 2019 was extended to 31st December 2019.
Was this initiative effective, though? Let’s take a look.
MORE: What is the impact of COVID-19 on Malaysia’s property market?
Did the Home Ownership Campaign (HOC) help alleviate the property overhang?
HOC is particularly aimed to help alleviate the glut of unsold properties in the market, as well as assisting aspiring homebuyers in getting a house at a lower entry cost. The campaign was initially targeted to run from 1st January 2019 to 30th June 2019, which was then extended to 31st December 2019. While it has been criticised as a means to bail out developers who have built the wrong products due to higher profit margin; HOC has no doubt, brought in some improvements to the local property market.
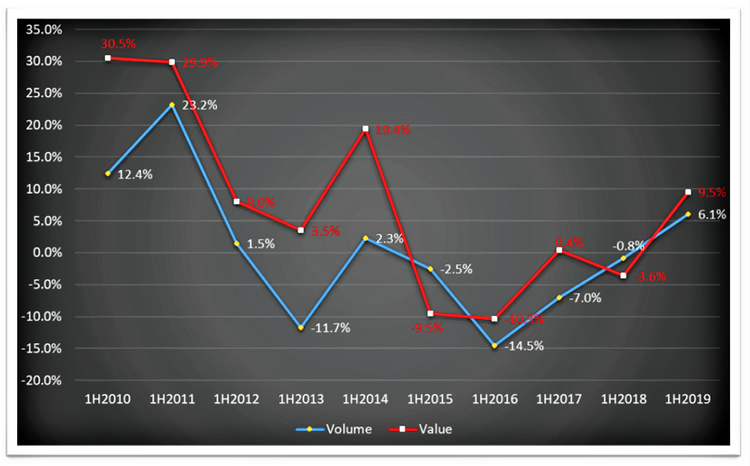
According to the Real Estate and Housing Developers’ Association Malaysia (REHDA), a total of 27,000 residential units had been sold as at November 2019, with a total sales value of RM21 billion. The bulk of the sales came from developments within the Klang Valley region; in which Selangor and Kuala Lumpur recorded the first and second highest in sales, respectively. The impact of HOC on the overall housing market has shown an increase in terms of volume and value of transaction in 1H2019 after the market has contracted consecutively for the last 4 years (Figure 1).
However, the sales performance achieved through HOC is less significant than expected. This is because HOC not only caters for “residential overhang units” – which is defined by National Property Information Centre (NAPIC) as completed housing units with CCC/Partial CCC that remained unsold for more than 9 months after its launch – but the HOC also covers housing products under the category of “Unsold Under Construction” and “Unsold Not Constructed”.
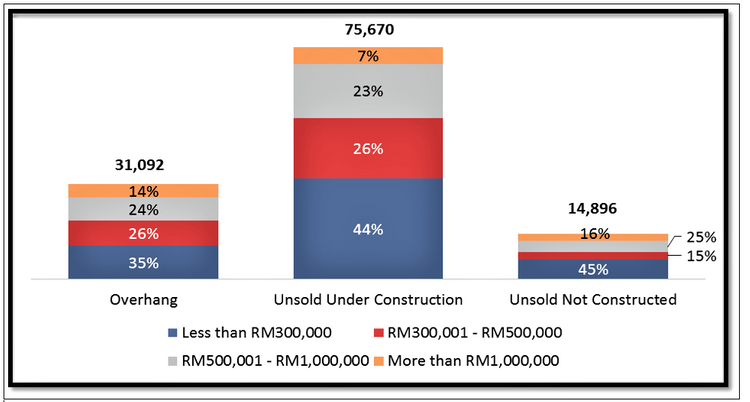
If these two categories of products are taken into account, one may find that the total unsold units in 3Q2019 amounts to 121,658 units (Figure 2); in which the total unit sold during HOC as of November 2019 (27,000 units) is just 22.2% of the unsold units. The products under these two categories would most likely turn into “residential overhang units” once they are completed, which would then further intensify the property overhang issue.
Why is the number of overhang properties increasing?
Often, it is generally claimed that the building of mismatched products in terms of location and pricing that does not respond to the mass market demand, is the main contributor to today’s residential property overhang conundrum – but it is not a true reflection to the whole picture. This is because further study on the composition of residential property overhang reveals that houses priced below RM300k are the major contributor (35%) to overhangs, followed by houses priced at RM300k – RM500k (27%), RM500k – RM1million (25%), and above RM1million (13%).

The situation becomes even more intense if houses under the category of “Unsold Under Construction” and “Unsold Not Constructed” are taken into account; where unsold units priced below RM300k far surpass the other product price ranges. Specifically, it amounts to 55,879 units or 43% of the overall unsold units in 3Q2019 (Figure 2).
This is a rather well indication suggesting that today’s residential property overhang is not merely caused by a skewed-market that is in favour of building high-end properties by profit-seeking developers. Instead, it is more likely caused by the excessive supply of housing stocks that outpaced the market’s limit of absorptivity. One must realise that every market has its limit of absorptivity, which can be observed by studying the take-up rate of new launches at different locations (Table 1).
Table 1: Take-up rate (%) of new launches, 2010 – 2018. © NAPIC
When the rate of housing production exceeds the rate of housing absorption, a property overhang tends to occur. Of course, the severity of overhangs is also intensified by the country’s economic performance, as it is directly related to the people’s purchasing power. Nevertheless, the main contributor to a property overhang is due to the oversupply of housing units.
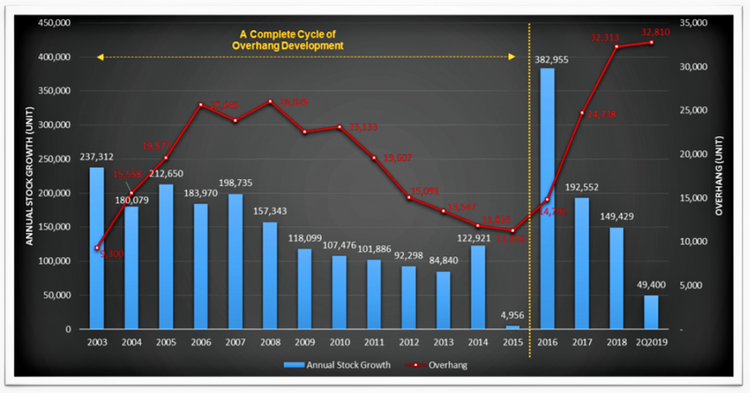
One should realise that a residential property overhang is there even when the market was booming. This is well illustrated in the period of 2010 – 2015, where the market was boosted by easy credit or lenient lending requirements as well as the implementation of the Developer Interest Bearing Scheme (DIBS). Unsurprisingly, this is also the period when property overhangs reduced drastically and consecutively, reaching its lowest level of 11,316 units in 2015 (Figure 3). However, let’s not forget that the annual property stock growth within this period was also in a downward trend in general, where the lowest growth was achieved in 2015, with 4,956 units.
How has the annual property stock growth affected the property market?
Annual property stock growth represents the additional completed units added into the existing inventory stock in a particular year as compared to the year before. The existing inventory stock, on the other hand, refers to units that have been issued with CCC/Partial CCC prior to or completed within the review period.
READ: Why Partial CCC should be disbarred for all homebuyers’ sakes
As one can observe in Figure 3, there were 237,312 units added into the existing inventory stock in 2003, resulting in the increase of property overhangs to 15,558 units in 2004. Again, with the annual stock growth of 212,650 in 2005, the number of residential property overhangs increased drastically to 25,645 in 2006. Similar incidents were also observed in 2007 (excessive supply) and 2008 (increase in overhangs) as well. From here, one can conclude that whenever there is an excessive supply in a particular year, the number of overhangs will be sure to increase in the following year.
How long will it take for the property glut to ease?
The number of overhangs will only come down if there is a reduction of property supply in the consecutive years, which is well depicted throughout the period of 2010 – 2013: both the stock growth and residential property overhangs declined from 107,476 and 23,133 in 2010 to 84,840 and 13,547 in 2013, respectively.

Historical data suggests that a period of 12 years (2003 – 2015) is required in order to restore the number of residential property overhangs back to its lowest level, which is from 9,300 units in 2003 to 11,316 units in 2015. In fact, the level of overhangs in 2015 was not fully recovered to the one in 2003, due to the excessive supply of 122,921 units in 2014.
Likewise, the housing overhang problem that we are facing today originated from the excessive supply in 2016 – 382,955 units – which is the highest since 2003. Excessive supply of property stocks in 2017 has caused the drastic increase of overhangs – 24,738 units in 2017, and the residual impact is then carried forward to 2018, continuing to intensify the housing market.
The housing market is, thus, expected to remain a challenge in the coming years as the unprecedented large property overhang will take more time for the market to absorb before the housing market could stage a meaningful recovery. In the meantime, the government needs to wisely monitor any implementation of new builds, so as to avoid the outgrowth of housing supply to the overall housing need in the country. This is the fundamental of the economic principles of supply and demand.
If you enjoyed this guide, read this next: What is the effect of COVID-19 on home loans?
Disclaimer: The information is provided for general information only. iProperty.com Malaysia Sdn Bhd makes no representations or warranties in relation to the information, including but not limited to any representation or warranty as to the fitness for any particular purpose of the information to the fullest extent permitted by law. While every effort has been made to ensure that the information provided in this article is accurate, reliable, and complete as of the time of writing, the information provided in this article should not be relied upon to make any financial, investment, real estate or legal decisions. Additionally, the information should not substitute advice from a trained professional who can take into account your personal facts and circumstances, and we accept no liability if you use the information to form decisions.