
Malaysia’s No.1 Property Site, iProperty.com.my revealed the country’s first-ever rental demand data publication. The H1 2020 Portal Demand Analytics (Rental Market) provides a macro view of current rental demand trends and shifts in Malaysia amid the global COVID-19 outbreak. Also, find out the most in-demand areas among rental property seekers that are ranked according to consumers’ visits data compiled from January to June 2020.
Note: To ensure that the demand data is of the highest quality, proper due diligence was conducted. This is on top of the certain measures that were put in place during the preparation of The iProperty.com.my H1 2020 Portal Demand Analytics (Rental Market). Please refer to the Notes section at the end of this article for more details.
The iProperty.com.my H1 2020 Portal Demand Analytics (Rental Market) is a rental demand-supply property report that’s compiled and published for the very first time in Malaysia. These real-time behaviours indicate where Malaysia’s residential rental demand (consumers’ visits to the site) is, in comparison to property supply (residential property rental listings on the site).
In this publication, we analysed the visits over our rental listings for the first half of 2020 where the demand growth trends are in comparison to the first half of 2019. The analysis aims to provide insight for investors and landlords on Malaysian residential rental property preferences.
The report focuses on four main regions; Kuala Lumpur, Selangor, Penang, and Johor. In this article, we will share the following highlights from the report:
- National overview of the Malaysian rental market
- Changes and shifts in demand for states and capital cities in Malaysia
- 20 Most in-demand areas in Kuala Lumpur and Selangor
- 14 Most in-demand areas Penang
- 9 Most in-demand areas in Johor
National Overview: Global pandemic contributed to demand decline
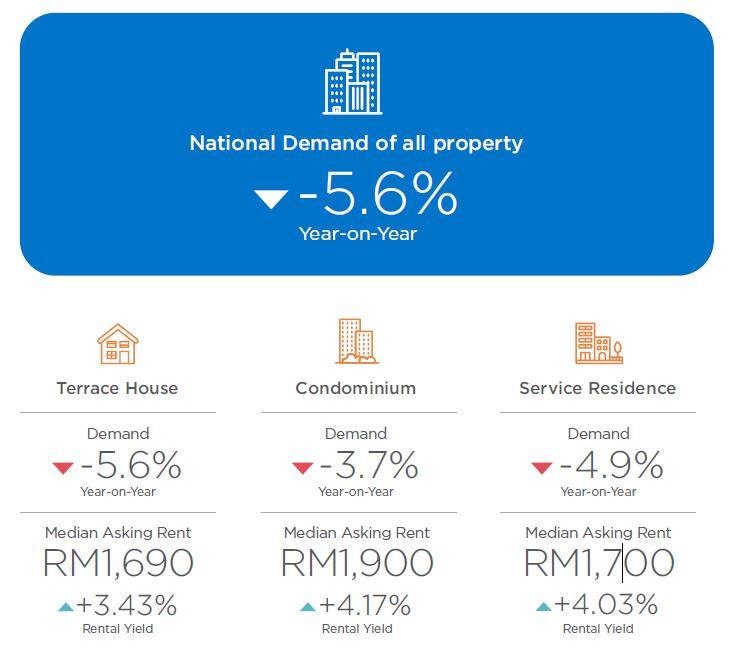
Overall, the H1 2020 national demand for rental property declined by -5.6% amid the global COVID-19 outbreak. The national lockdown which was enforced in mid-March 2020 brought various economic activities to a grinding halt, including property viewings due to various restrictions. Even though big purchases such as the property will likely be pushed back as consumers may limit spending to only essential items to ensure financial sustainability, the rental market may benefit from this situation as housing is still considered a necessity for most people.
SEE WHAT OTHERS ARE READING:
💰 Properties vs stocks: Which is a better investment?
📈 Top high-rise properties with the highest rental yield.
The transition from the Movement Control Order (MCO) to the Conditional MCO (CMCO) followed by the Recovery MCO (RMCO) has allowed for a gradual economic and social recovery. This observation is supported by the recovery in property interest during the CMCO phase when the government relaxed various physical restrictions. We began to see an increase in rental visits and listings on iProperty.com.my as property viewings were permitted again.
Organic rental visits on the portal
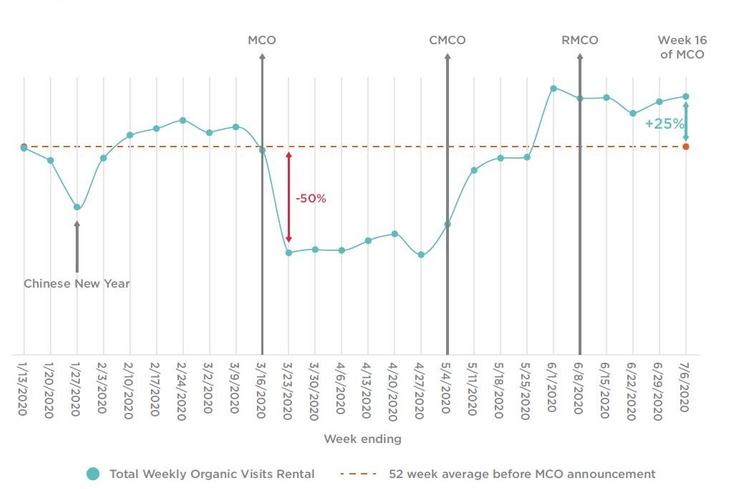
One month into the RMCO and by the end of the first week of July, organic searches for rental property listings saw an upward recovery of +25%. This growth is comparable to the 52-week pre-MCO average, allowing us to analyse our recovery using a one-year pre-MCO benchmark.
The upward movement towards the end of H1 2020 dampened the initial effects of the pandemic and contributed towards a lower overall decline of -5.6%. In H1 2020, lower-priced high-rise properties recorded a higher rental yield of above 4% compared to landed properties. Condominiums and serviced residences recorded rental yields of 4.17% and 4.03%, respectively, while terrace houses recorded a 3.43% yield.
On the other hand, the serviced residence was the most popular property type among consumers within the four major capital cities, Kuala Lumpur (KL), Selangor, Penang, and Johor. Consumers were looking for serviced residences with asking rent of below RM 2,500 per month.
Demand in Selangor shifted to suburban areas
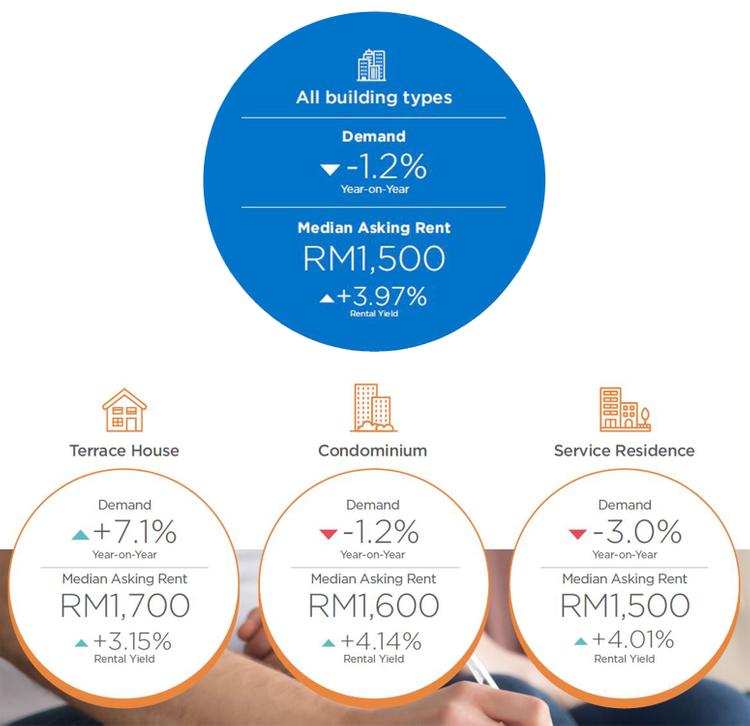
Selangor’s property figures were in line with KL (-2.9%) as it recorded a marginal decline of -1.2% for rental demand. In Selangor, rental demand has shifted to suburban areas like Ulu Kelang and Batu Caves due to affordable prices. Within these areas, consumers were mainly looking for highrise residences with low-entry prices. Batu Caves’s high demand growth was contributed mainly by the condominium segment. Visitors were looking at rental properties below RM1,200 per month.
The median rental asking rent for Selangor is RM 1,500. A large number of visits were contributed by the condominium segment as consumers were interested in rental properties below RM2,000 per month. This could also be one of the reasons why Ulu Kelang recorded a higher rental yield compared to other areas in Selangor. For H1 2020, Ulu Kelang was the fastest-growing area with an impressive +44.21% increase in year-on-year (YoY) demand growth. As we go in-depth later, the data also revealed that the top 20 most in-demand areas in Selangor are dominated by suburban townships.
Johor recorded the lowest asking rental compared to other major states
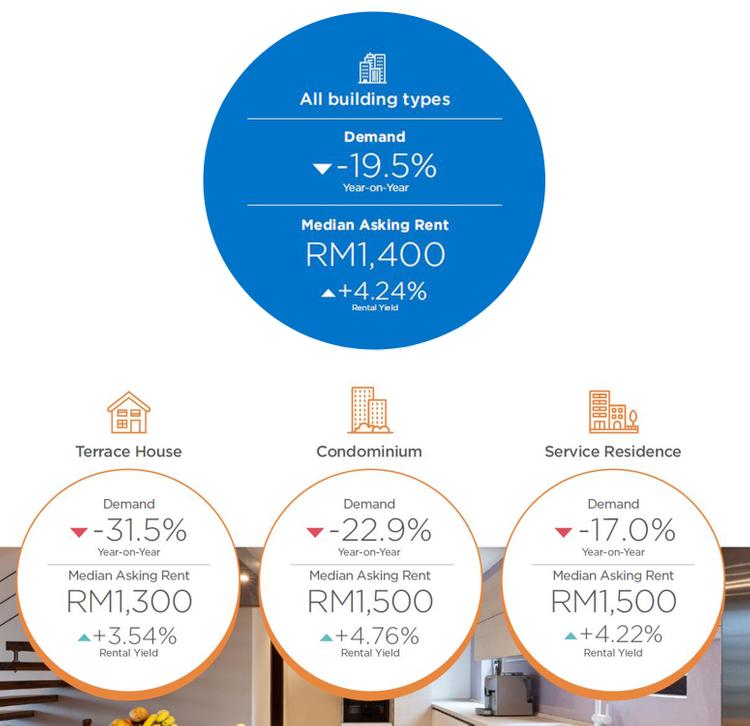
Johor’s rental demand dropped by -19.5% in H1 2020 due to the increasing number of listings which outweighed the increasing number of visits. Nevertheless, the asking rental for Johor, at RM1,400 was still lower compared to other major states in the country.
In Johor, Iskandar Puteri recorded the fastest growing YoY demand at +35% because its rental listings were reduced by half, mainly for the condominium segment. Many visitors were looking for rental properties below RM2,500 per month.
20 Most in-demand areas in H1 2020 – KL and Selangor
The areas below were ranked according to the area/property listings which garnered the highest number of unique visits from 1 January to 30 June 2020.
KUALA LUMPUR
- Taman Tun Dr Ismail
- Wangsa Maju
- Damansara Heights
- Pantai
- Sentul
- Setapak
- Jalan Ipoh
- Sungai Besi
- Brickfields
- Bangsar
- Cheras
- Kepong
- Jalan Kuching
- Kuchai Lama
- Bukit Jalil
- Bandar Menjalara
- Segambut
- KL Sentral
- Ampang Hilir
- Seputeh
The economic centre of Malaysia, KL recorded a modest decline of -2.9% for its rental property market. TTDI takes the crown for the most in-demand area in KL. In TTDI, most people were looking at serviced residences with asking rentals between RM2,500 and RM3,00 per month. Among the areas with the best rental yield in H1 2020 were Pantai and Brickfields.
SELANGOR
- Bangi
- Klang
- Sunway
- Rawang
- Shah Alam
- Setia Alam
- Semenyih
- Glenmarie
- Damansara Damai
- Petaling Jaya
- Damansara Perdana
- Cyberjaya
- Sungai Buloh
- Kajang
- Subang Jaya
- Ampang
- Bandar Utama
- 18.Batu Caves
- Tanjong Duabelas
- Ulu Kelang
The top 20 most in-demand areas in Selangor are dominated by suburban townships. Bangi tops the chart with the number of visits surpassed the number of listings. Many consumers were looking at service residences for rent below RM1,500 per month.
14 Most in-demand areas in H1 2020 – Penang
PENANG
- Simpang Ampat
- Bukit Mertajam
- Ayer Itam
- Butterworth
- Bayan Baru
- George Town
- Sungai Ara
- Jelutong
- Bayan Lepas
- Batu Feringghi
- Tanjong Bungah
- Gelugor
- Pulau Tikus
- Tanjung Tokong
Border closure affected the rental market demand in Penang. It declined by -13.7%. Even though visits and listings in Penang grew in H1 2020, overall rental market demand in the Pearl of the Orient declined by -13.7%. Simpang Ampat was the most in-demand residential option for the locals. Within this area, many consumers were looking at terrace houses with asking rental prices below RM1,000 per month.
9 Most in-demand areas in H1 2020 – Johor
JOHOR
- Pasir Gudang
- Gelang Patah
- Masai
- Skudai
- Tampoi
- Johor Bahru
- Permas Jaya
- Tebrau
- Iskandar Puteri (Nusajaya)
Johor’s most in-demand area, Pasir Gudang also garnered the highest rental yield in the state for H1 2020. This industrial town recorded a high rental yield of close to 7%, while its asking rental was very attractive at RM1,200 per month. In Pasir Gudang, many consumers were looking at the terrace house segment.
For more insights, you may check out the full report on our website. To download the full H1 2020 Portal Demand Analytics (Rental Market) publication, click here.
NOTES
1) Considerations and measures put in place:
- Only areas with more than 350 listings were selected to negate the effects of any spikes.
- Unique visits were used to prevent a single user from distorting the demand figures through multiple visits.
- In cases where a single user visits multiple areas, the visit is equally weighted across the various areas and building types to maintain the uniqueness of the user.
- All visits used in this report are based on organic and direct traffic only.
- The median rental yield was calculated by taking the median of all rental yields by projects in a given group.
2) Definitions
- Unique Visit: Based on Google Analytics tracking of unique visitors, with multiple visits by one visitor are counted as one unique visit.
- Active Property Listing: Property listings in iProperty.com.my that were active for at least one day and had a minimum of 1 view.
- Property Demand: The number of unique visits over the number of active property listings.
- Organic / Direct Traffic: Based on Google Analytics tracking, organic and direct traffics are not obtained through paid services or other sites
TOP ARTICLES JUST FOR YOU:
⭐[EXCLUSIVE] Demand-supply residential property report for H1 2020.
🏘️ Top 5 areas in Malaysia for properties below RM 500,000.
🔍 [LIST] Most searched areas by Malaysian homebuyers.