
This article looks at the various ways to identify a property cycle. In the context of investing in property development companies listed on Bursa Malaysia, the Malaysian House Price Index is the best metric to use for identifying the Malaysian property cycle.

It is commonly acknowledged that the property market is cyclical. According to renowned Finance Professor, Professor Aswath Damodaran, cyclical and commodity companies share a common feature. Their value is often dependent on the movement of a macro variable, namely commodity price – than on the firm’s specific characteristics.
The biggest problem in analysing and valuing property development companies is that the earnings reported in the most recent year are a function of where they are in the cycle. Extrapolating those numbers into the future can result in wrong valuations. One way around this is to “normalize” the earnings and cash flows over the cycle. This requires you to have an understanding of the performance over the cycle. But what exactly is a property cycle?
As defined by Wikipedia, a property cycle is a sequence of recurrent events reflected in demographic, economic and emotional factors that affect supply and demand for property, subsequently influencing the market. The property cycle follows a predictable pattern, which reveals three distinct phases namely Boom followed by Slump and finally Recovery before the next cycle repeats. There are other descriptions of these phases – for example, some use Recovery, Explosive and Recession to describe them.
For a retail investor, the question is not the description of the phases. The more important question is what are the metrics or indicators to use to identify the pattern? In other words, how do you identify the start and end of the current cycle in real-time?
In this article, we will take a look at the Malaysian property cycles and suggest the best metric to identify the cycle in real-time. Once you have this information, you can then determine the performance of property development companies over the cycle. This is important for assessing whether there is a stock market investment opportunity. Alternatively, if you are a property buyer hunting for bargains, knowing when is the trough of a cycle will be useful.
Article Summary
- I looked at 3 metrics to identify the Malaysian property cycle – Malaysian House Price Index (HPI), Residential Starts and Residential Transactions.
- How many property cycles were there in Malaysia from 2002 to 2020? These 3 metrics do not give the same answer. It also varies depending on whether you look at trendlines or % annual changes. Refer to Charts 1 and 2.
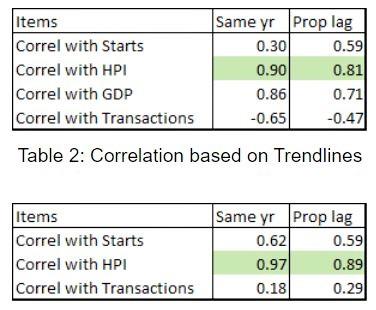
- From an equity investment perspective, which metric had the best link with the revenue of the property companies? The HPI had the best correlation at 0.87 or higher.
What does the Malaysian property cycle mean?
The majority of articles online used price as the metric to identify a property cycle. Of course, price was not the only method. Some looked at property activities whereas the more academic articles constructed their own econometric indicators.
Table 1 summarizes the results of this ‘back-of-envelope” survey.
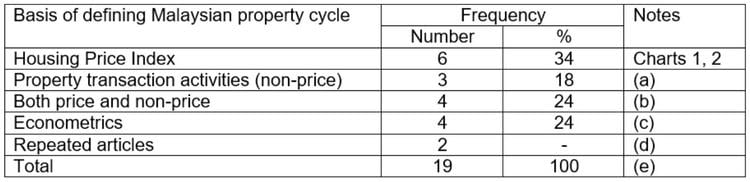
NOTES:
(a) These are generally non-pricing statistics. Examples are the number of transactions, unsold stocks, vacancies, or even construction activities.
(b) These included econometric indicators developed by the respective authors. These could involve pricing and non-pricing data.
(c) Some of the media articles referred to other articles listed in the top 2 pages of the Google search results. In such cases, I ignored them thereby reducing the number of articles.
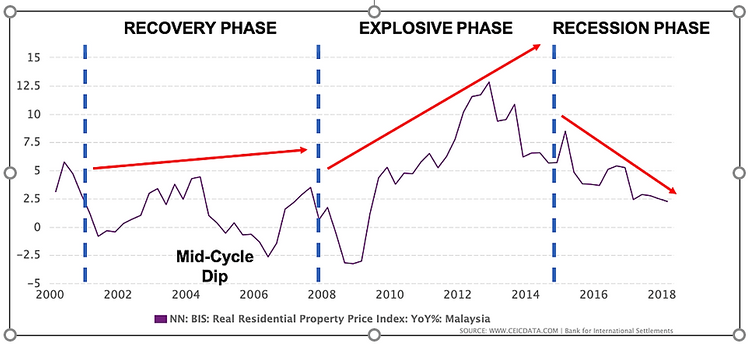
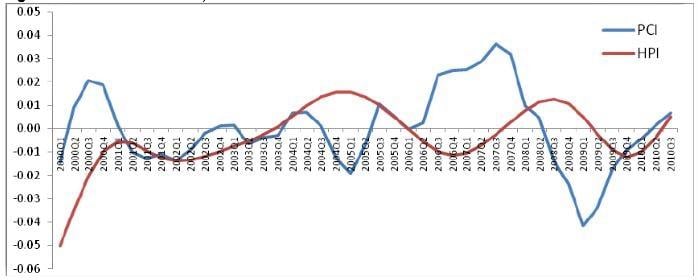
An example of how prices are used to identify the Malaysian property cycle is this 2019 article “What is the 18-year property cycle & how will it make you a better investor?” The article used the annual change in the Malaysian House Price Index to identify the Malaysian Property cycle as illustrated below.
There are even econometric models that build on the House Price Index to create a metric to identify the cycle as illustrated in Chart 4.
But is the House Price Index the only way to define a property cycle? This article looks at alternative ways to identify the property cycle.
There are of course several components of the property market – residential, retail, and industrial. For the purpose of this article, I will focus on the residential market since it is the largest component in Malaysia.
According to Savills, China and the US together make up 42% of global property value alone. China owns the largest share home of global real estate (by value) at USD 42.7 trillion, just ahead of the USA at USD 42.1 trillion. However, as there are more online resources about the USA, it was natural that I looked at the USA for references.
OP ARTICLES JUST FOR YOU

 Capital Growth or Rental Yield: Which is More Important in Property Investment?
Is residential real estate still a good hedge against inflation in Malaysia?
Housing Market Indicators in the USA

There are several metrics that can be used to track the performance of the property sector in the USA. Investopedia listed the following as the top US Housing Market indicators:
- Construction spending – This covers construction work done on new structures. It also includes improvements to existing structures in both private and public sectors.
- Housing Starts – This focuses on the houses that builders have just started to work on.
- Home sales – Various realtors such as the National Association of Realtors (NAR) provide a report on the number of used homes sold every month. There are also pending sales reports.
- Housing Market Index – For example, the National Association of Home Builders (NAHB) puts out a monthly NAHB/Wells Fargo Housing Market Index that looks at the level of confidence that builders have in the single-family housing market. The AEI Housing Market Indicators present a comprehensive picture of the state of the housing market in America. Their metrics included home prices and supply, new construction sales and additions to the housing stock, lending standards, housing affordability and land prices.
- Housing Price Indices – These included those by FRED and the S&P/Case-Shiller US National Home Price Index.
In the Malaysian context, not all the above information is readily available to the retail investor. I would rank the ease of getting the Malaysian data as follows:
- Malaysian House Price Index – The Malaysian National Property Information Centre, Valuation and Property Services Department, Ministry of Finance is responsible for publishing the House Price Index.
- Residential transactions data are provided in the Property Market Report published by the Valuation and Property Services Department (JPPH). Data are available in terms of the number of units and property value. I would consider this equivalent to the US Home sales information.
- Residential Starts – The same Property Market Reports have sections on Residential Starts. I would equate these to the US Housing Starts data. To a certain extent, residential starts reflect the housing construction activities.
iProperty Transactions: Get the latest subsale property transaction data for FREE to help you make the best-informed property decisions. No sign-ups required!
Performance of the Malaysian metrics
Chart 3 illustrated how pricing information had been used to identify the property cycle. How would the Residential transactions and Residential Starts perform compared to the House Price Index?
I compared these 3 metrics using 2 approaches:
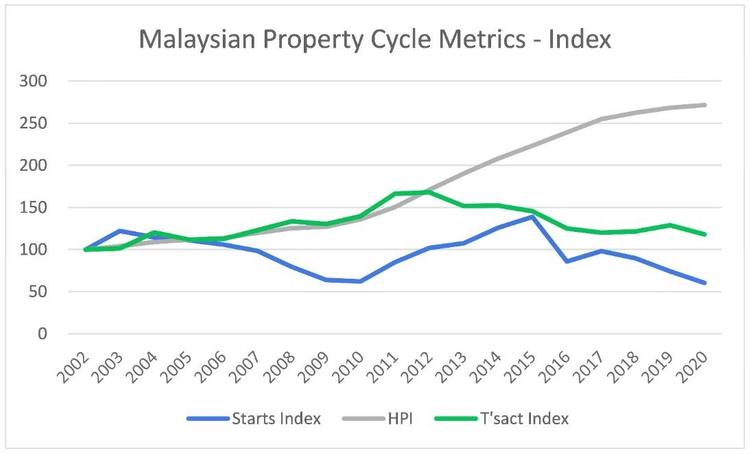
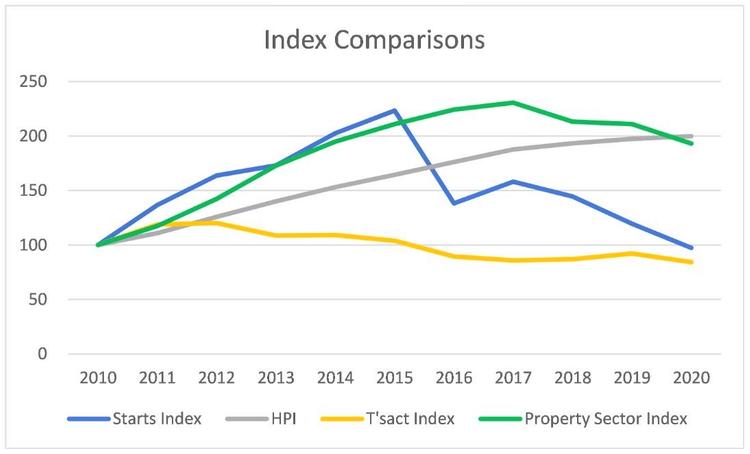
- Looking at the trends of the metrics from 2002 to 2020 as shown in Chart 1. Note that for ease of comparison, I constructed the index for each metric. For the respective index, the value in 2002 was assumed to be 100. The index value for the various years was then computed relative to this base of 100.
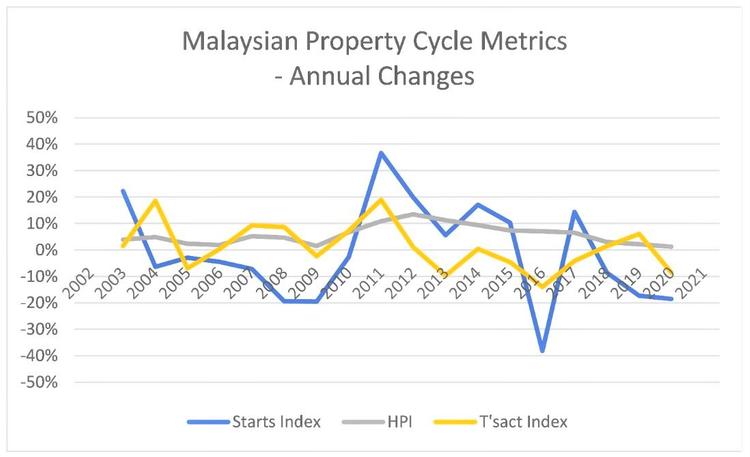
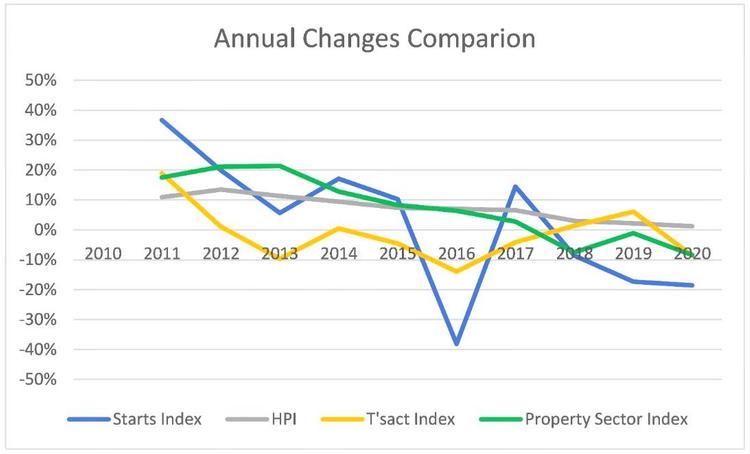
- Looking at the annual percentage changes of the respective indices as shown in Chart 2.
Referring to Chart 3, the period 2002 to 2018 represented one property cycle. However, Residential Starts and Residential Transactions showed a different picture.
- Looking at House Price Index (HPI) trend in Chart 1, you could not see the cyclical pattern. Part of the reason for this is that the value of the HPI was also increasing over time. Thus the growth had masked the cyclical pattern. But you could make out the cyclical pattern with the % annual change in the HPI in Chart 2.
- Based on the Residential Starts Index, you could see more than one cycle during this period. This can be seen from both the trend and annual change charts. Note that the relatively “horizontal” Residential Starts Index trendline meant that there has not been significant growth in the number of Residential Starts. In fact, the 2020 Residential Starts was lower than that in 2002.
- Looking at the number of Residential Transactions, Chart 1 shows one cycle. But looking at the % annual change of this metric indicates more than one cycle during the 2002 to 2020 period. I would also like to point out that the “horizontal” Transaction trendline meant that there has not been any growth in the number of Residential Transactions in 2020 compared to 2002.
The challenge then is deciding which of these metrics shows the real picture. Remember that you are trying to determine the start and end of the cycle in real-time. I would argue that the property cycle is the result of 4 key factors – demographics, interest rates, the general economy and government policies. As such looking at only one metric such as price alone may not show an accurate picture.
How long does a property market cycle last?
The iProperty.com article cited earlier talked about an 18-year cycle.
“Sometime in the early 20th century, Homer Hoyt, a real estate professional discovered that property prices are cyclical. He also realized that these cycles happened in almost perfect 18-year cycles. Hoyt’s research was popularised by economist, Fred Harrison, in his book “Boom Bust.” Interestingly, this book which was written in 2005, predicted the 2008 housing crash in the USA.”
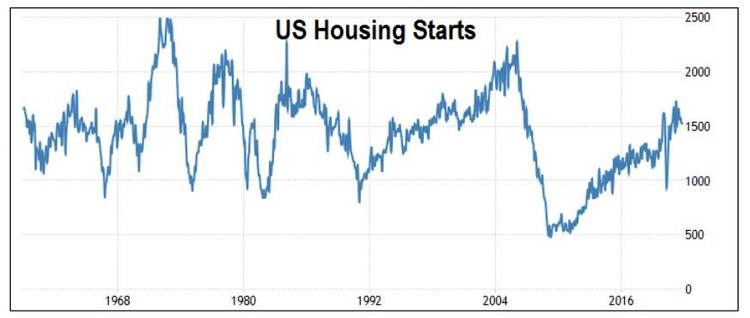
According to the article, the current cycle started in 2000 and the end of the cycle is then 2018. But I am sure you would all agree that given the Covid-19 impact, the current cycle is far from over. I have another example to illustrate the shortcomings of the 18 years cycle concept. The chart below shows the US Housing Starts over the last 70 years. You can see the cyclical pattern.
- Based on starting from the peak, the current cycle is now about 18 years old and it does not look like it has reached its latest peak.
- From 1968 to 1980, there appeared to be at least two cycles. This meant that the average cycle duration is about 6 years.
Property cycle metrics vs the property sector revenue
- Correlating the Property sector revenue trendline with the 3 metrics trendlines.
- Correlating the annual changes in the Property sector revenue with the annual changes in the 3 metrics.
- The same year’s performance between the Property sector revenue and the metrics.
- The Property sector revenue lagged the metrics by one year. For example, the 2010 Residential Starts was compared with the 2011 Property sector revenue.
- Individual and individual.
- Developer and individual.
- Company and individual.
- Company and company.
- Others.
- 0.86 based on the trendlines.
- 0.54 based on the % annual changes.